Comparison indicators

Compare load centers, substations or measurement points against each other — by day, week or month — on consumption, cost, emissions and power quality.

Compare in order to prioritise

The Energy Comparison Indicators module puts the organisation's points side by side. The question it answers is not how much the plant consumes, but which of its parts consumes too much, which costs most, and which is degrading quality.

Periodicity is chosen between day, week and month, and the date selector follows that choice: whole months for the monthly view, Monday-to-Sunday weeks for the weekly one.

The date range must close complete periods; comparing a full month against half a month is the easiest way to reach a wrong conclusion.

What it compares

  • Energy consumption in kWh by point and period
  • Associated energy cost
  • Greenhouse gas emissions in kg of CO2
  • Power factor (Cos φ) and selected power quality indicators
  • Percentage variation between periods

How it is used

Choose the periodicity, set the date range, and the platform builds the comparison across the selected points.
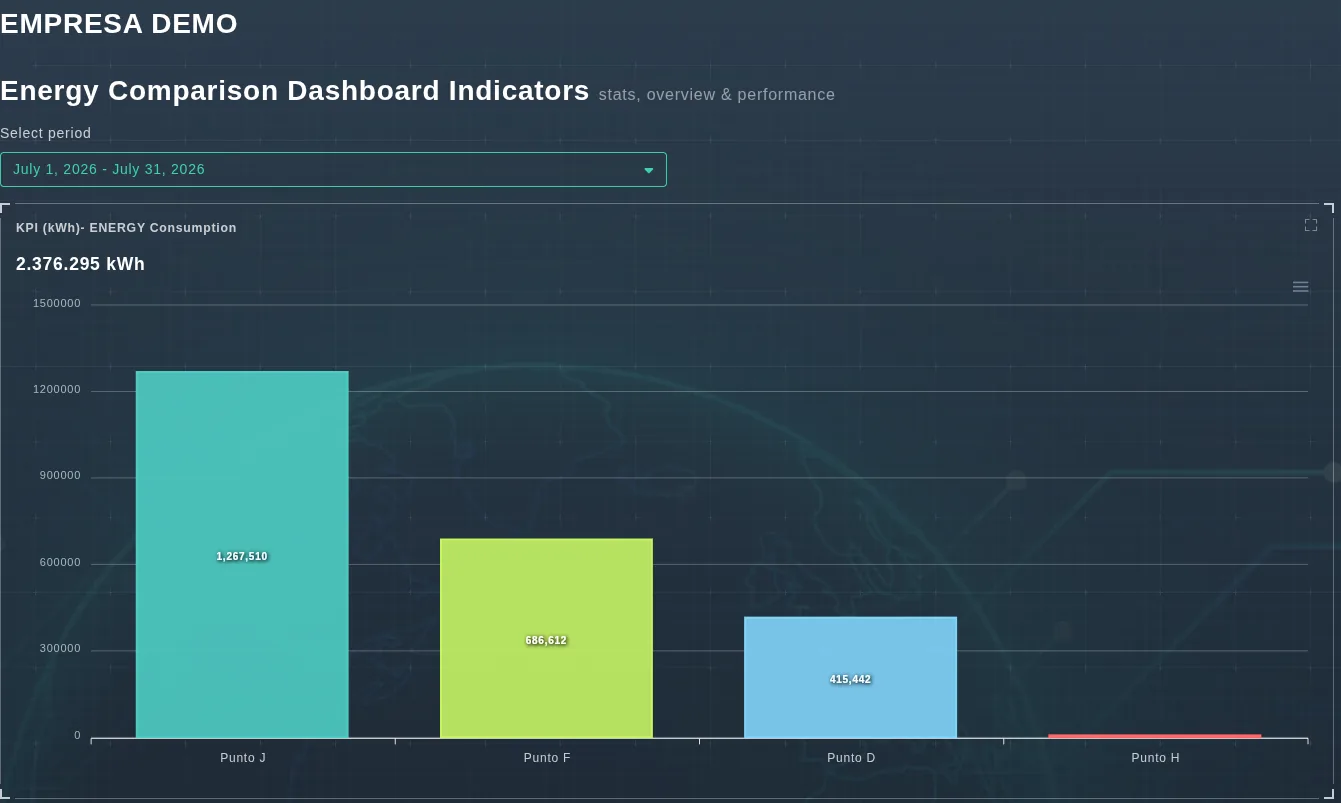
EVA-Smart AI comparison indicators comparing consumption across measurement points
Period consumption compared across measurement points, with the accumulated total and the same breakdown available for cost, emissions and quality.

Controls

  • Periodicity: day, week or month.
  • Date range: aligned to complete periods.
  • Scope: load centers, substations or measurement points.

Decisions it supports

  • Prioritise which plant or substation to invest in first.
  • Spot a point drifting from the rest with no operational cause to explain it.
  • Back emissions reporting with measurement rather than estimates.
  • Allocate energy cost across areas on a defensible basis.

Compare your own load centers

Book an EVA-Smart AI demo using your organisation's real structure.

Request a demo