Consumption analytics

A chart generator over any point's measurement: six different views — from the load curve to voltage and frequency disconnections — at whatever period and granularity the analysis calls for.

The total doesn't say where it went

The Consumption Information module is the platform's charting system. A monthly total gives you nothing to act on; the curve by hour, by shift or by substation does, because it shows when and where consumption concentrates.

The query is defined once — dates, aggregation and substation — and the Chart selector changes the view without redefining it: the same measurement window seen as current, powers, load factor, voltage thresholds or disconnections.

To see the operating cycle use a fine granularity; to compare months, longer aggregations that remove daily noise.

What it reveals

  • Line currents per phase
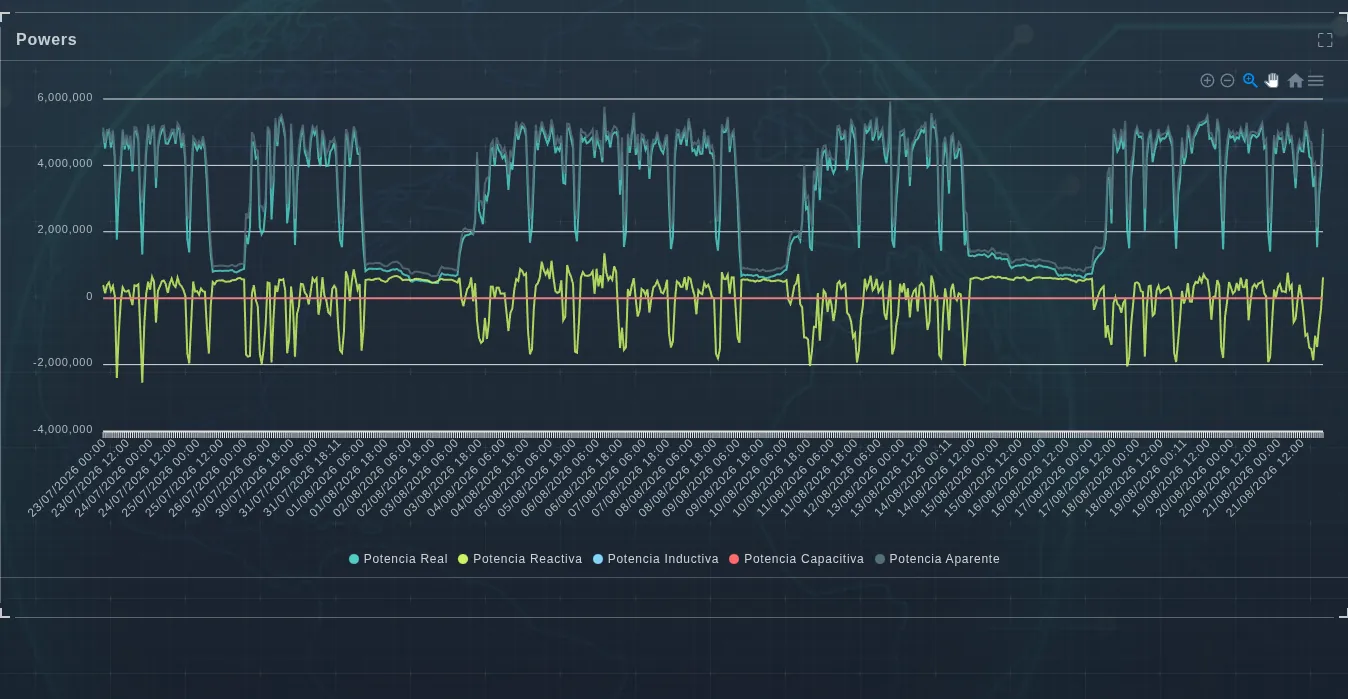
  • Real, reactive, inductive, capacitive and apparent power
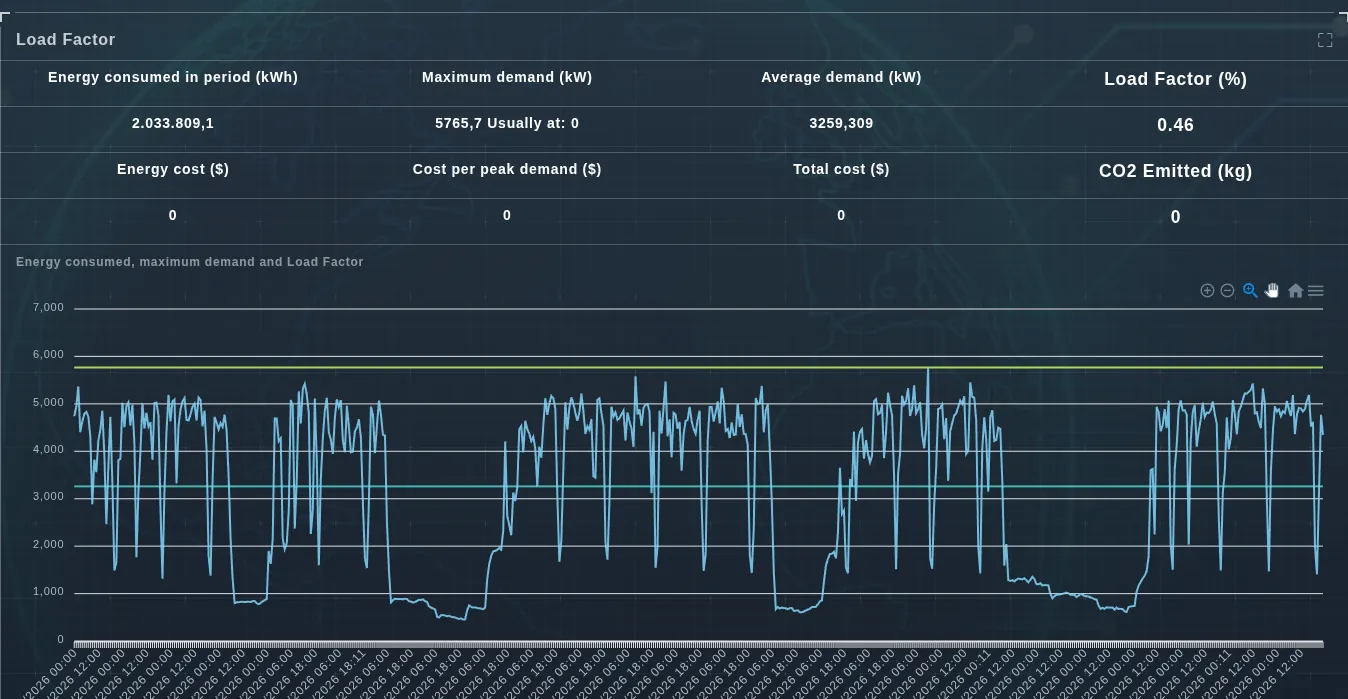
  • Load factor with energy, maximum and average demand
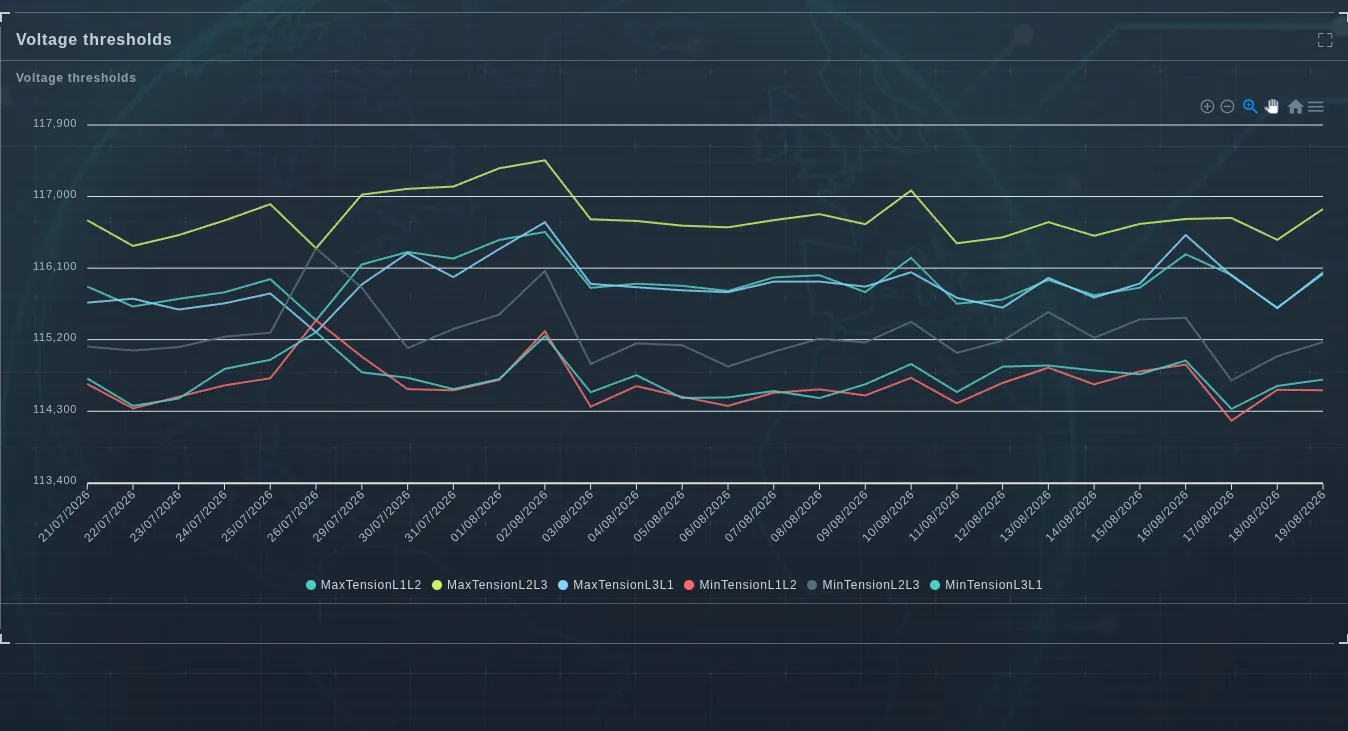
  • Maximum and minimum voltage thresholds per line
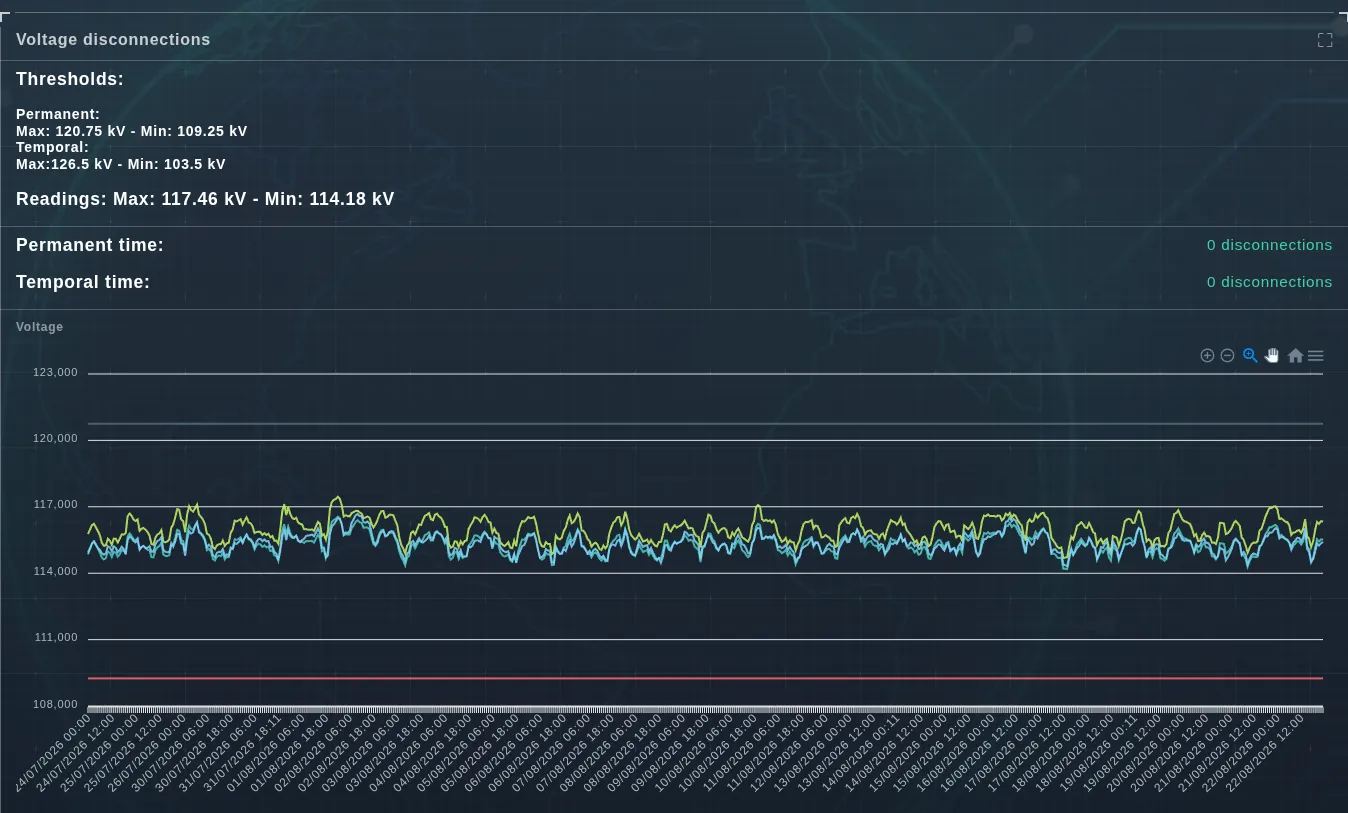
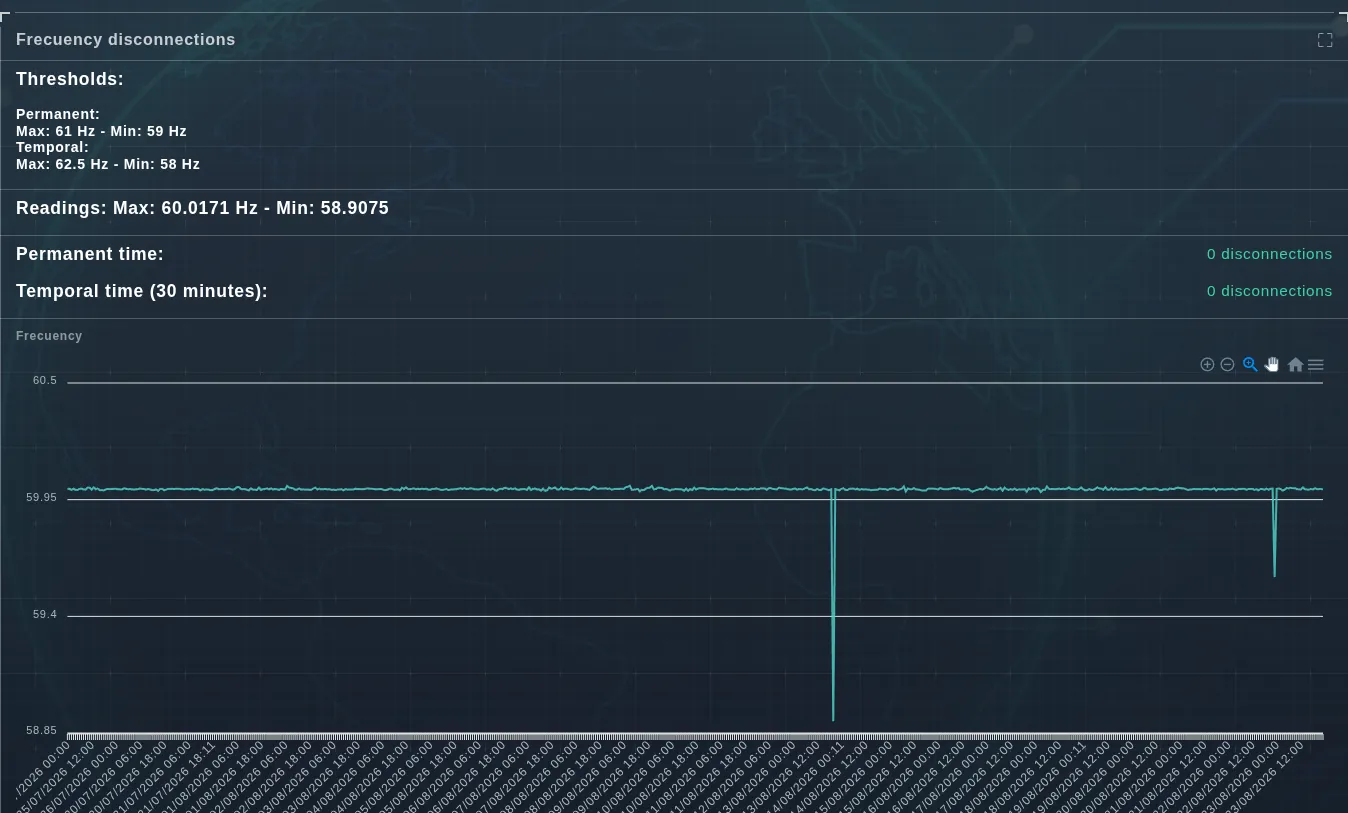
  • Voltage and frequency disconnections against their thresholds

How the query is built

Four controls, then run it with Select data.

Controls

  • Period: the date range to analyse.
  • Granularity: the chart's resolution.
  • Substation: the scope of the query.
  • Chart selector: the representation to show.

Decisions it supports

  • Detect consumption during downtime, weekends or between shifts.
  • Pin down which substation grew without production growing.
  • Back an efficiency measure with the before and after curves.
  • Prepare the energy baseline for an ISO 50001 management system.

The six charts it generates

One selector, one measurement point, one period — and six different readings of the same data.
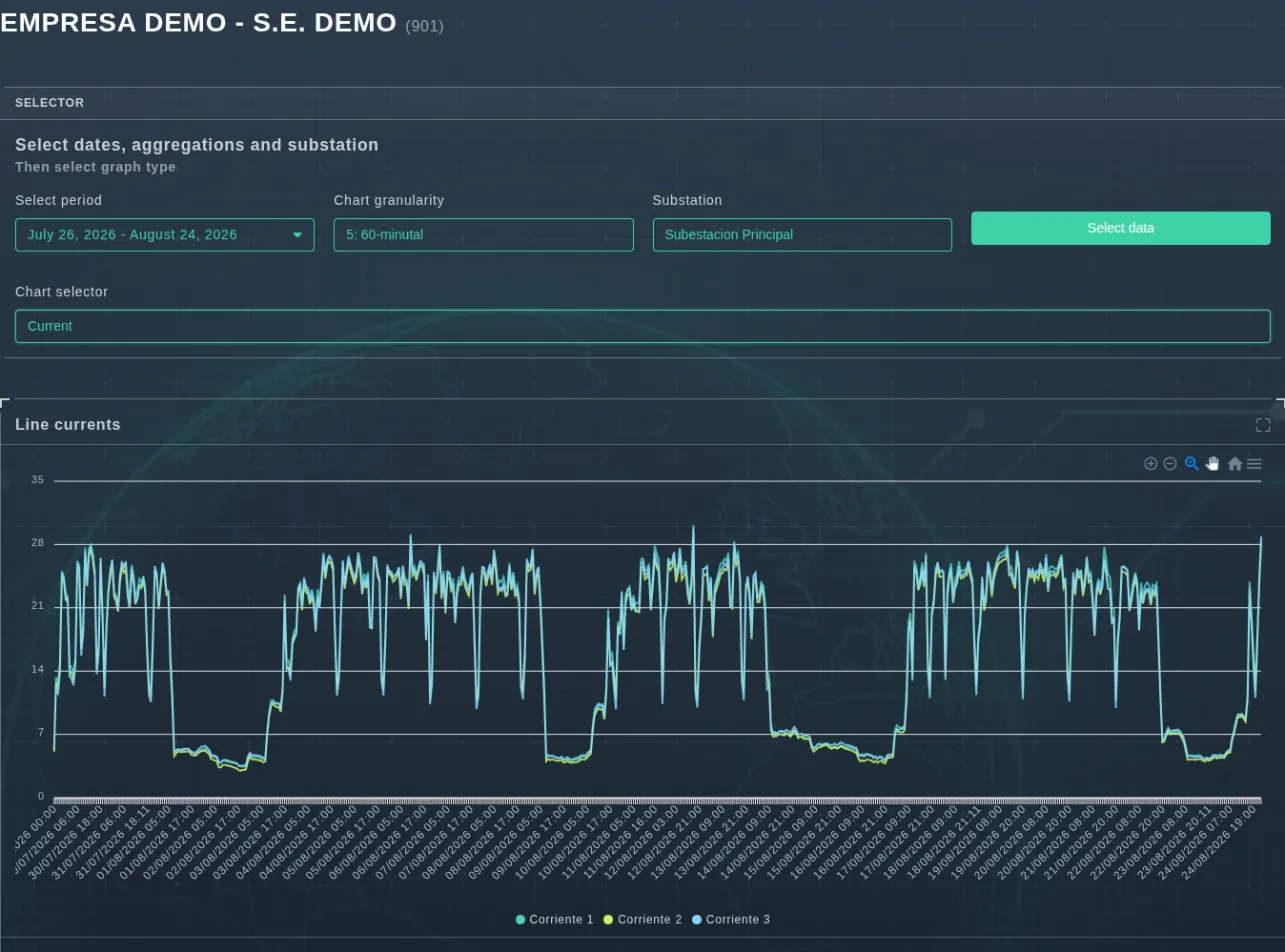
Line currents across the three phases over a month, aggregated hourly
Line currents. The operating cycle is plain to see: the valleys are shutdowns, the plateaus are productive shifts.
Real, reactive, inductive, capacitive and apparent power over the period
Period powers: real, reactive, inductive, capacitive and apparent on one chart. Reactive crossing below zero flags overcompensation.
Period load factor with energy consumed, maximum and average demand
Load factor with its summary: period energy, maximum and average demand, cost and CO2 emitted.
Voltage disconnections against the permanent and temporal thresholds
Voltage disconnections: permanent and temporal thresholds, the period's extreme readings and the disconnection count.
Frequency disconnections with 59 to 61 Hz thresholds
Frequency disconnections, evaluated against the permanent (59–61 Hz) and temporal (58–62.5 Hz) ranges.
Maximum and minimum voltage per line across the period
Voltage thresholds: maximum and minimum for each line pair, day by day.

Analyse your own load curve

Book an EVA-Smart AI demo and let's review a real period from your plant.

Request a demo