Demand and load factor

Peak demand against contracted demand, with each month's utilisation percentage and load factor: the analysis that decides whether you are paying for capacity you never use.

Contracted capacity against capacity used

The Demand & Load Factor Analysis module compares each month's actual peak demand with contracted demand, and computes what share of that capacity was used. It is the review that most often returns money, because contracted demand is set once and rarely revisited.

Load factor completes the picture: it measures how even consumption was. A low factor means short peaks setting a high charge on modest consumption.

A persistently low utilisation percentage is a direct signal that contracted demand sits above what is needed.

Table columns

  • The month's peak demand in kW and its variation
  • Contracted demand
  • Capacity utilisation percentage
  • Period energy in kWh
  • Load factor and its variation
  • Demand charge and $/kW
  • The period's power factor

How to read it

The module opens as a dashboard: a row of period indicators and six charts covering twelve months plus the prior year.
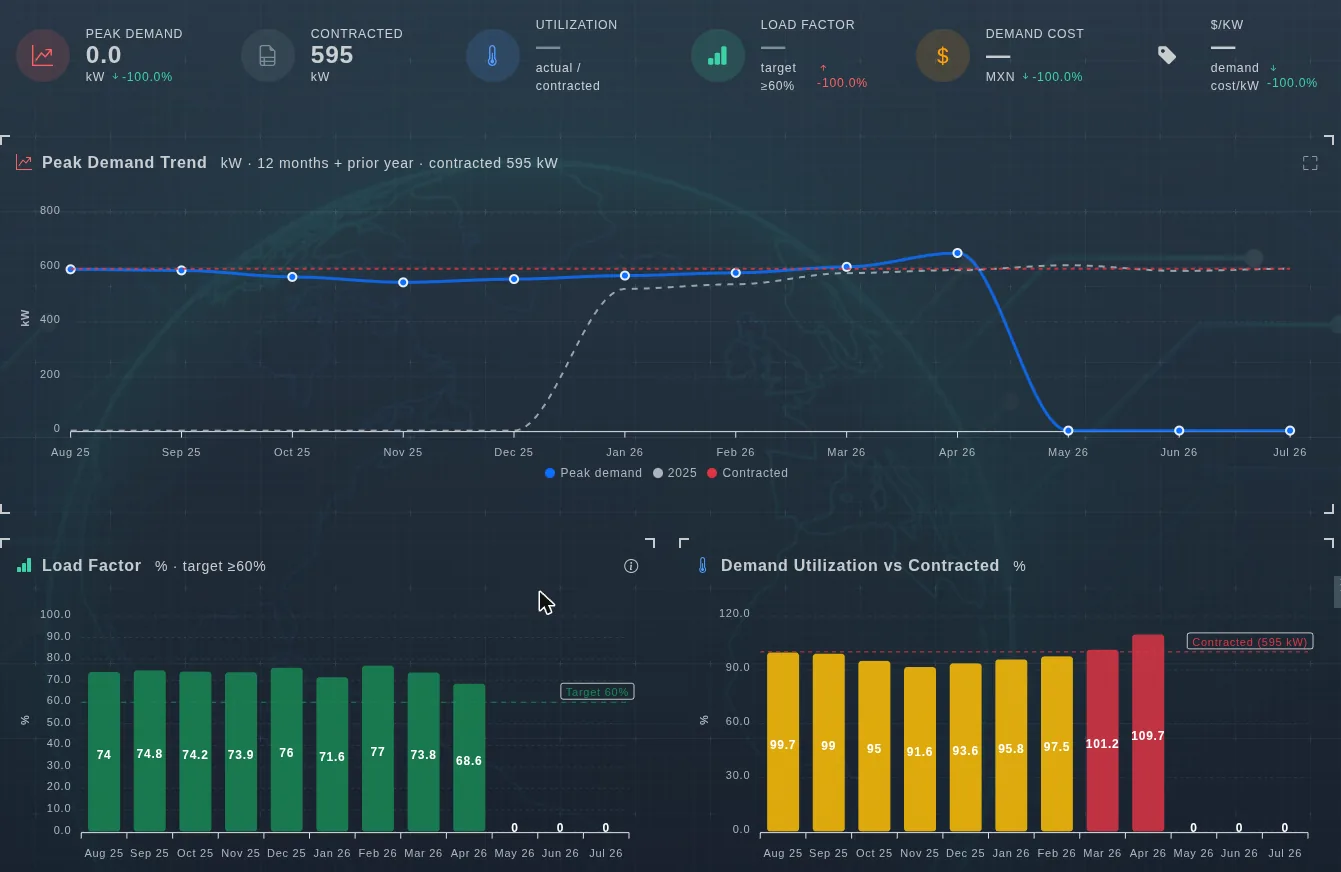
EVA-Smart AI demand and load factor dashboard
Period indicators, peak demand trend against contracted, load factor versus target, and capacity utilisation month by month.

What each row compares

  • Peak against contracted: the capacity gap.
  • Utilisation %: how much of the contract was used.
  • Load factor: how even consumption was.
  • $/kW: what each kW of capacity costs.

Decisions it enables

  • Renegotiate contracted demand with months of evidence.
  • Quantify what a short peak costs in demand charges.
  • Assess whether shifting loads to flatten the curve pays off.
  • Rank plants by which has the most expensive capacity gap.

Review your contracted demand

Book an EVA-Smart AI demo and let's look at your installation's real gap.

Request a demo