Demand opportunity ranking

Your load centers ranked by reachable savings: you set a target load factor and the platform computes how much headroom each point has.

Where to start

The Demand Opportunity Ranking module answers the resource allocation question. With fifteen measurement points and budget to act on two, you need a criterion; this module supplies it by ranking on opportunity.

The calculation starts from a target load factor you define. Against that target, each load center shows how far it sits and what closing the gap is worth.

You set the target: it is not a regulatory value but the operational goal you consider reachable for your kind of process.

What it ranks

  • Load centers ordered by opportunity
  • The gap against the target load factor
  • Estimated reachable saving per point
  • Selection by year and month
  • Comparison across all points or a subset

How it is computed

Choose the period, define the target, and apply it over the selected load centers. The result is a dashboard: portfolio indicators, the savings ranking, each center's load factor, and an opportunity map plotting load factor against cost.
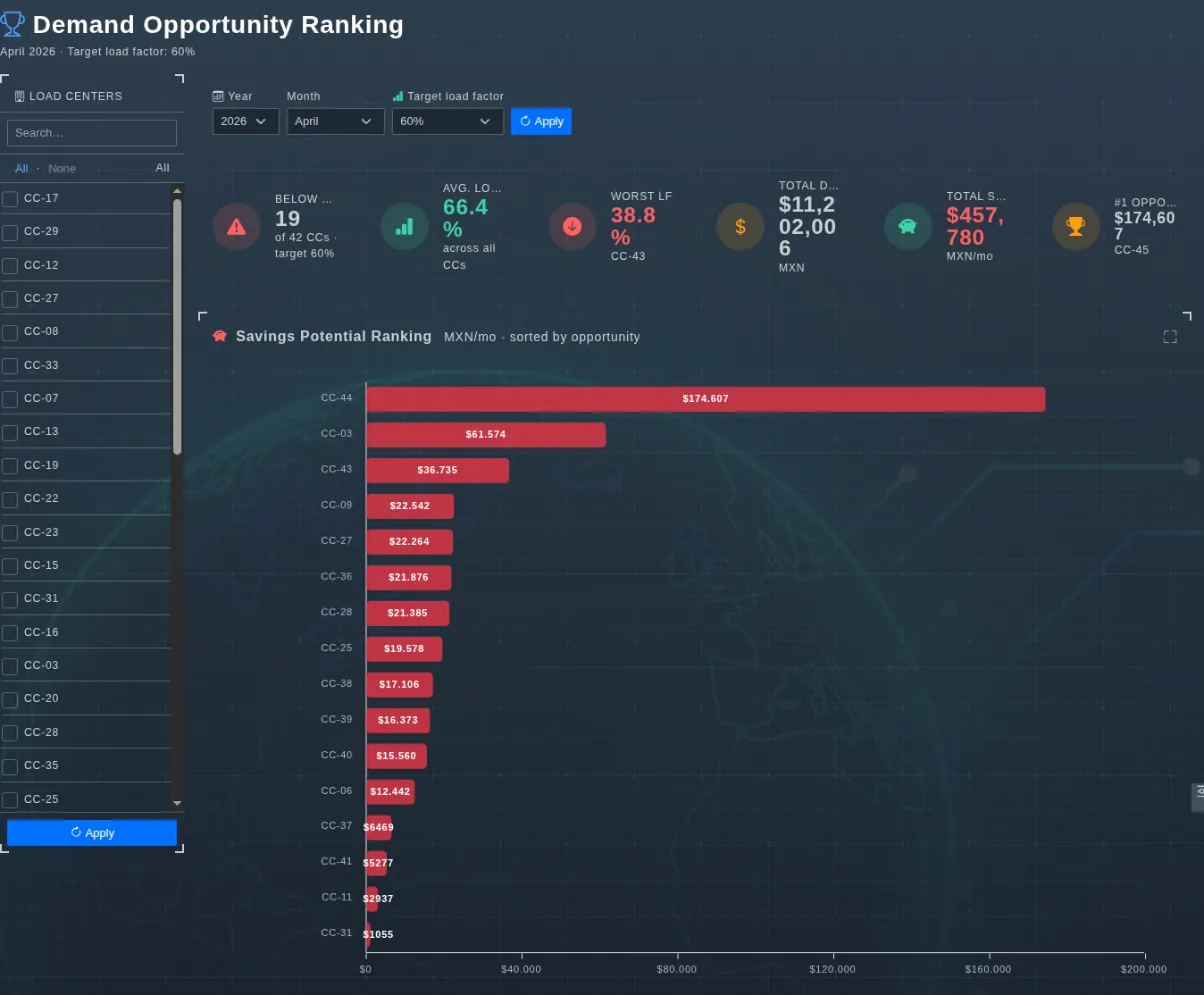
EVA-Smart AI demand opportunity ranking ordering load centers by reachable savings
Against a 60% load factor target, 19 of 42 load centers fall short and reachable savings add up to $457,780 a month. The ranking orders them by opportunity: the first one alone is worth $174,607.

Controls

  • Load center: all, none or a selection.
  • Year and month: the period evaluated.
  • Target load factor: the goal the gap is measured against.

What it is for

  • Direct a limited budget at the points with most return.
  • Defend a priority with a numeric criterion rather than perception.
  • Set per-plant targets on a comparable basis.
  • Track progress against the target month by month.

Rank your opportunities by return

Book an EVA-Smart AI demo using your real load centers.

Request a demo