How they are queried
The same mechanics across all three views: scope it, run it, export it. The table sorts on any column and is paginated, so a long period can be navigated without downloading all of it.
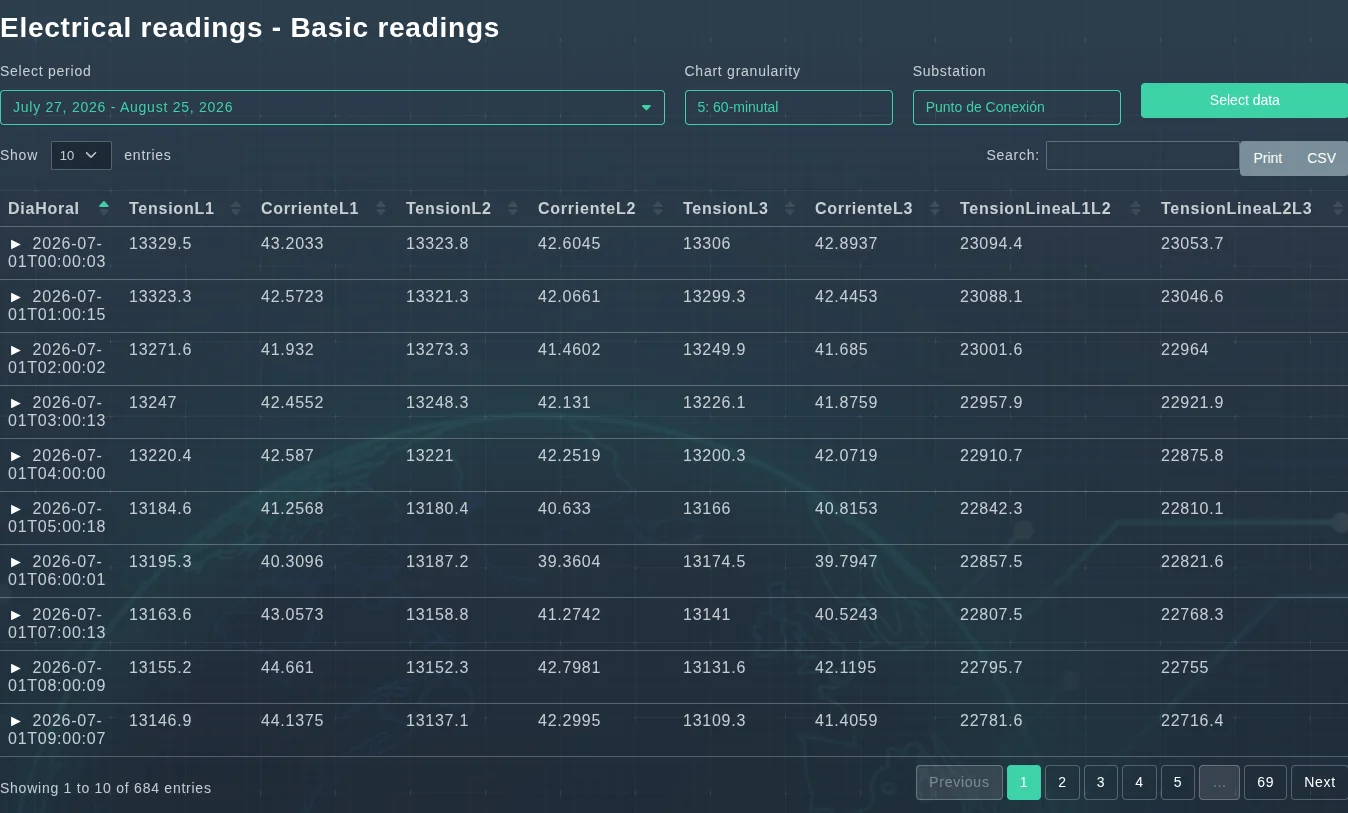
Shared controls
- Period: the date range queried.
- Granularity: how records are aggregated.
- Substation: the measurement point.
- Search and pagination: to locate a specific record.
- Export: direct printing or CSV download.
What it is used for
- Back an opinion with the original reading rather than a summary.
- Reproduce a calculation independently.
- Take the period into your own analysis tool.
- Verify a figure that does not match what a dashboard shows.