Injection molding monitor

A real-time operations dashboard for an injection moulding machine — state, cycle, OEE and energy per part — built from electrical measurement alone, with no PLC connection and no sensors added to the machine.

The current was already telling the story

An injection moulding machine leaves an unmistakable electrical signature: the injection peak, the holding plateau, the drop into cooling, the idle pass. Sampling power twice a second, Injection Molding Monitor reconstructs the full cycle and knows which state the machine is in at any moment.

Everything else follows: the shot count, cycle time against target, how the shift splits between production, downtime, warm-up and changeover, and OEE computed to ISO 22400.

None of it requires touching the machine. No control integration, no added sensors, no stoppage to install: the electrical metering already in place for energy turns out to be enough to read the process.

Power zones are the heart of the method: each kW band maps to a cycle state — idle, mould operations, hold, injection peak — and the transition between bands marks the move from one state to the next.

What the dashboard shows

  • Current machine state and progress through the running cycle
  • Shift OEE, availability and performance
  • Cycle time and shots per hour, each against target
  • Live power at half-second resolution
  • Shots per shift and resulting parts from the cavity count
  • Shift energy balance: productive consumption against idle loss
  • kWh per part and peak demand
  • How time is split across cycle states
  • Shift timeline: production, downtime, warm-up and changeover

How it looks on the floor

The header identifies machine and shift — type, tonnage, material and cavities — and the dashboard updates live while the machine runs.
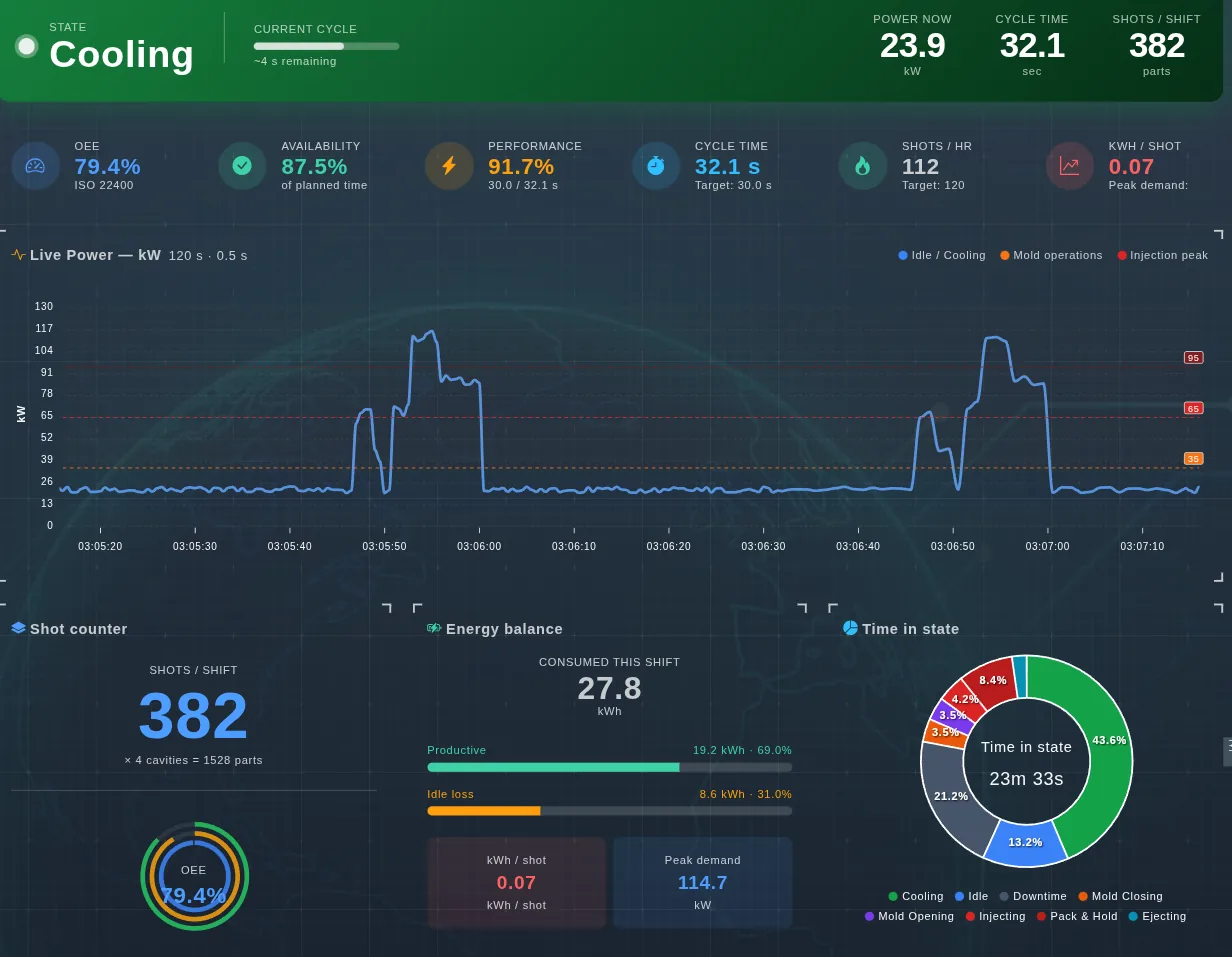
EVA-Smart AI injection moulding monitor with live power, OEE and energy balance
Cycle state, shift indicators, live power at half-second resolution, and the split between productive consumption and idle loss.

What it reveals that was invisible

  • Idle loss: separated from productive consumption; it is often close to a third of the shift.
  • Real cycle against target: a few seconds per shot, multiplied across the shift.
  • Undeclared downtime: idle time that appears in no report.
  • kWh per part: unit energy cost, comparable across machines and across moulds.

Beyond injection moulding

  • This is the first of a line. The method — reading a process from its electrical signature — is not specific to injection moulding.
  • Any process with electrically distinguishable states allows an equivalent dashboard: extrusion, compressors, furnaces, milling, pumping.
  • It is built to fit the process and the indicators your operation needs to see.
  • It reuses metering already installed for energy, with no instrumentation project.

How state is inferred from power

Each consumption band maps to a phase of the cycle. The machine does not report its state: the dashboard deduces it from how much power it is drawing.

Power zoneInferred stateWhat is happening
0 – 8 kWOff / standbyNo active cycle
8 – 35 kWIdle / coolingThermal holding and waiting between shots
35 – 65 kWMould operationsClosing, opening and ejection
65 – 95 kWPack and holdHolding pressure after injection
95 – 120 kWInjection peakFilling the cavities
Zones are calibrated per machine. A different unit — another tonnage, another material, electric rather than hydraulic — has its own signature, and the dashboard is fitted to it.

Which process would you like to see this way?

We build operations and process control dashboards tailored to your process, on the electrical measurement you already have. Tell us which one and we'll assess it with you.

Let's talk about your process