The variables it plots
Same point, same window, one selector — each variable answers a different question.
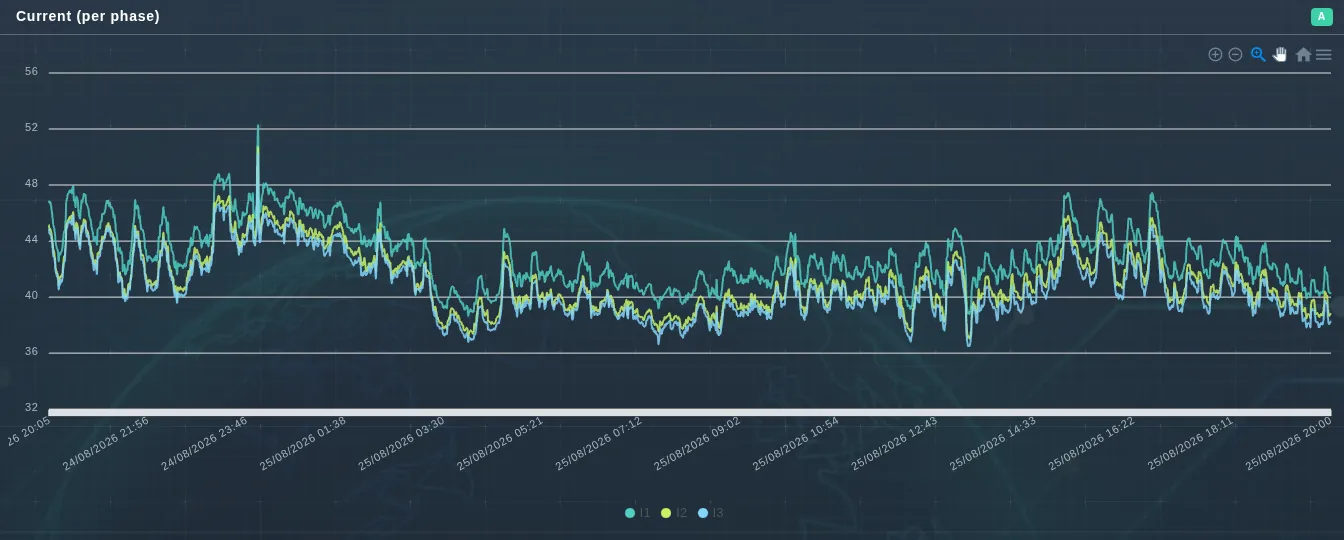
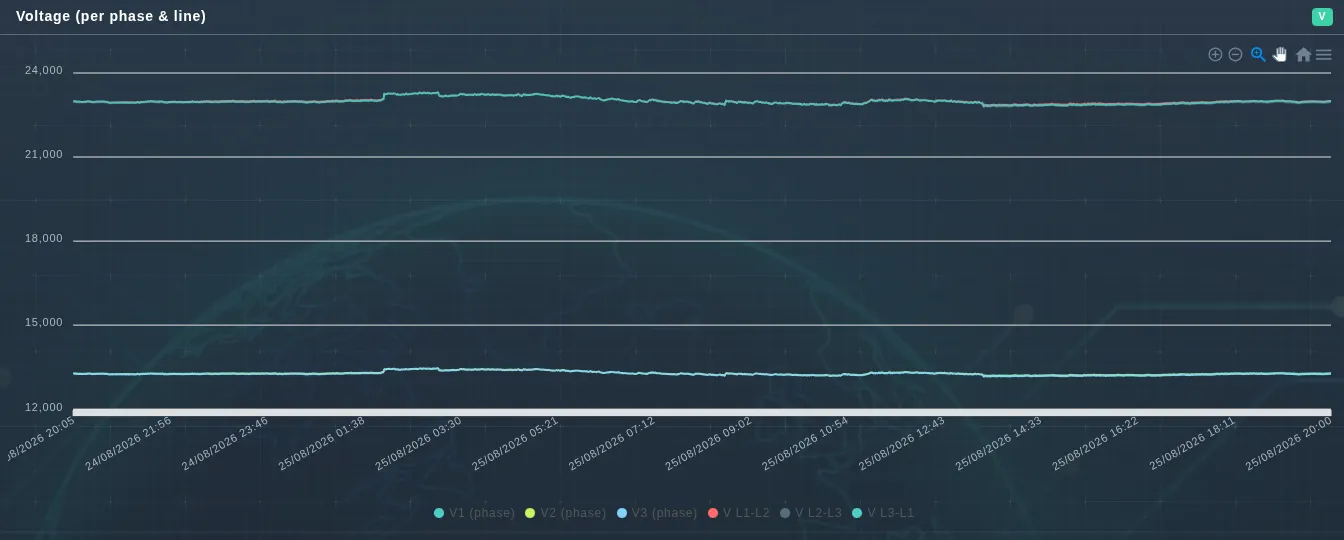
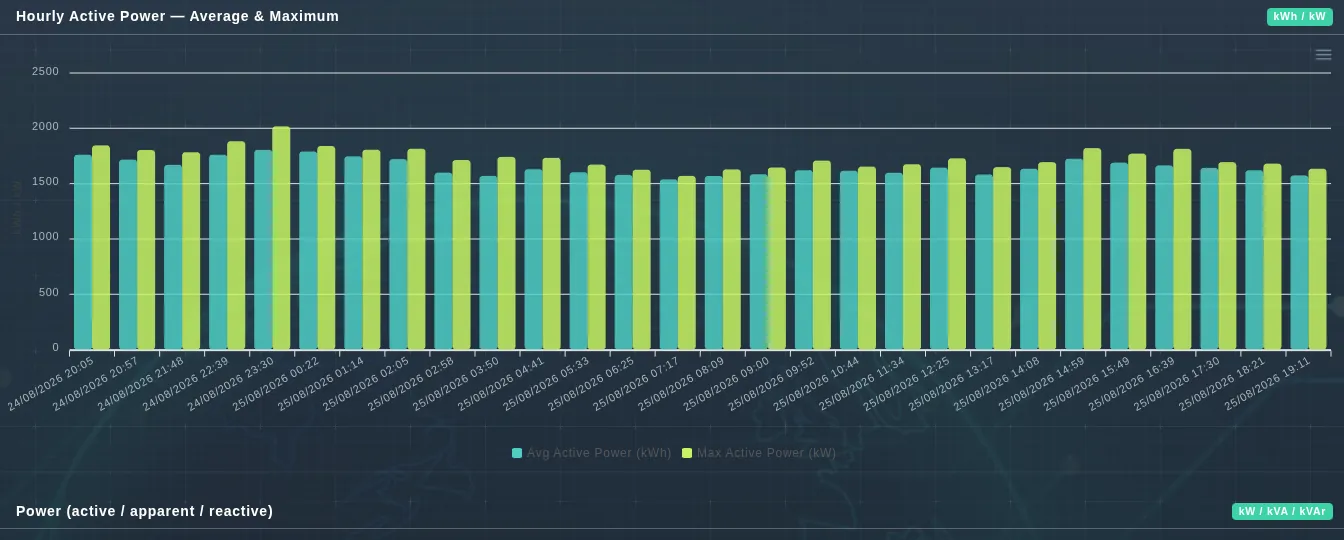
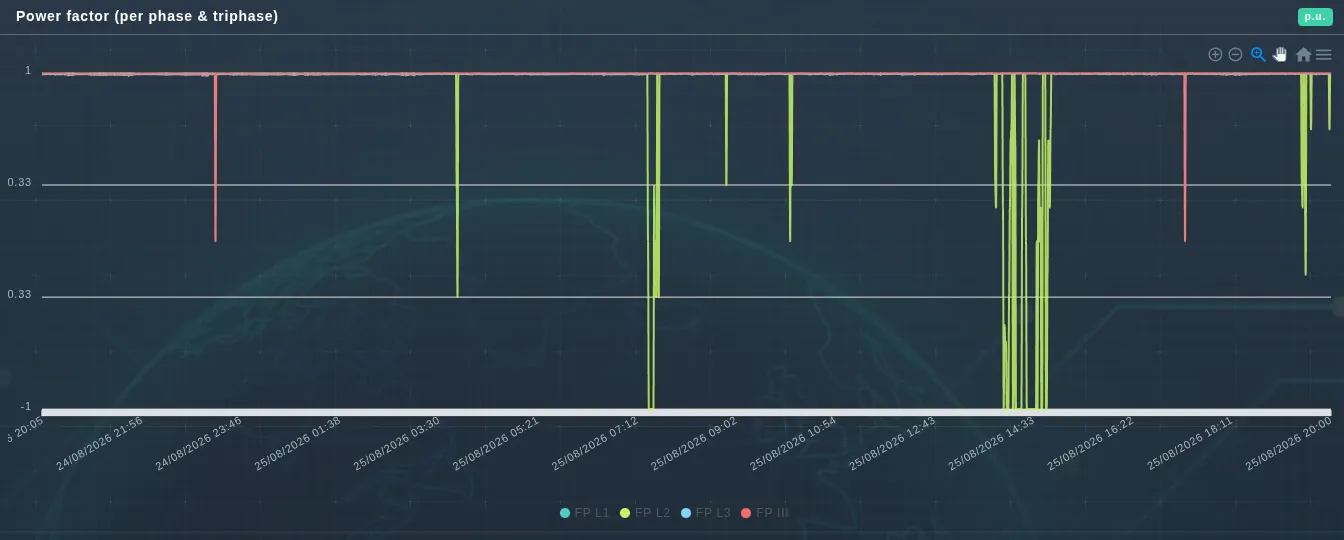
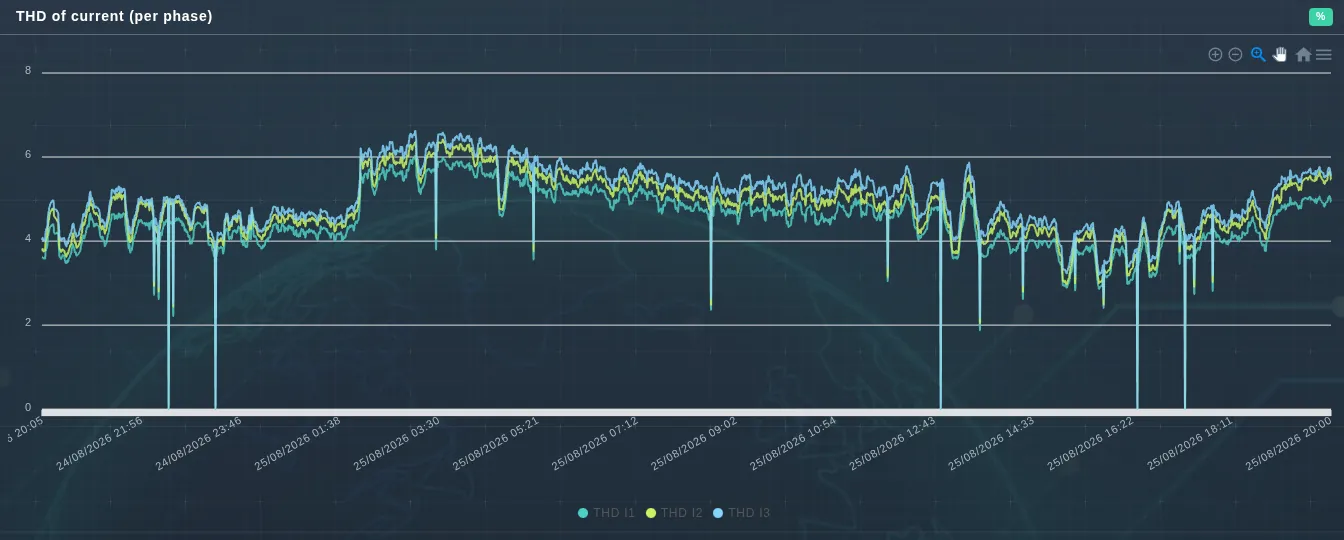
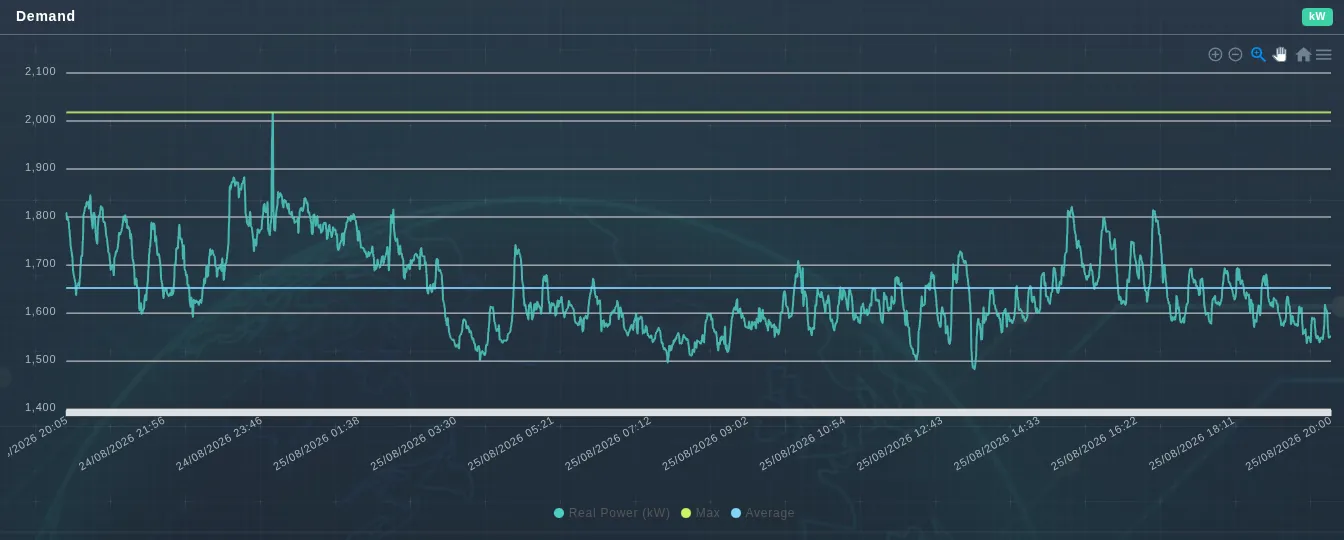
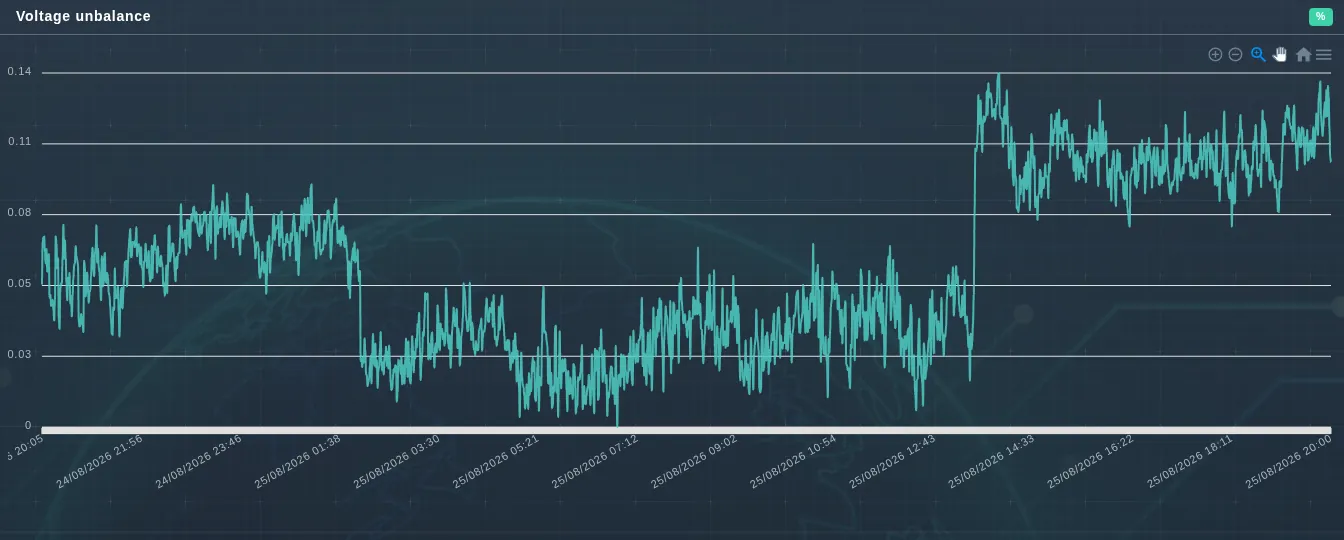
Free-form charting of the electrical variables at any measurement point, at whatever granularity and window the analysis calls for.
Where the dashboard gives a fixed view, Dynamic Monitoring Charts lets you build the chart: pick the variable, the measurement point, the resolution and the time window, and the platform draws it from the actual measurements.
This is the module you reach for once you know what you are looking for: correlating an event with a machine start, comparing behaviour across phases, or checking whether a pattern repeats by shift.
Four controls define the query, and the chart is drawn once data loading is switched on.
Same point, same window, one selector — each variable answers a different question.