Power statistics

Statistical analysis of the period's electrical variables — percentiles, averages and extremes — which is how the standard asks you to evaluate, not the instantaneous value.

The statistics the standard asks for

The Power Statistical Data module summarises a full period's behaviour using the statistics an installation is actually judged by. An isolated peak does not define compliance; the period's percentile does.

The analysis is defined by a date range, an accumulation period and the measurement point, and returns the distribution of each variable across that window.

Percentiles and averages are computed over the chosen accumulation period, so they stay comparable with the regulatory approach and with normal diagnostic practice.

What it delivers

  • Period percentiles per electrical variable
  • Averages and extreme values, minimum and maximum
  • The distribution of behaviour within the analysed window
  • Results by substation and measurement point

How it is set up

Three controls define the statistical query.

Controls

  • Date range: the complete period to evaluate.
  • Accumulation period: the window each sample is aggregated over.
  • Substation: the measurement point analysed.

What it is used for

  • Back a compliance opinion with the right statistic rather than the worst reading.
  • Compare the same point's behaviour across two periods.
  • Size equipment from the real distribution instead of the peak value.
  • Prepare the technical evidence for a regulatory review.

The same point at three accumulations

The accumulation period changes the question the chart answers — the measurement underneath is the same.
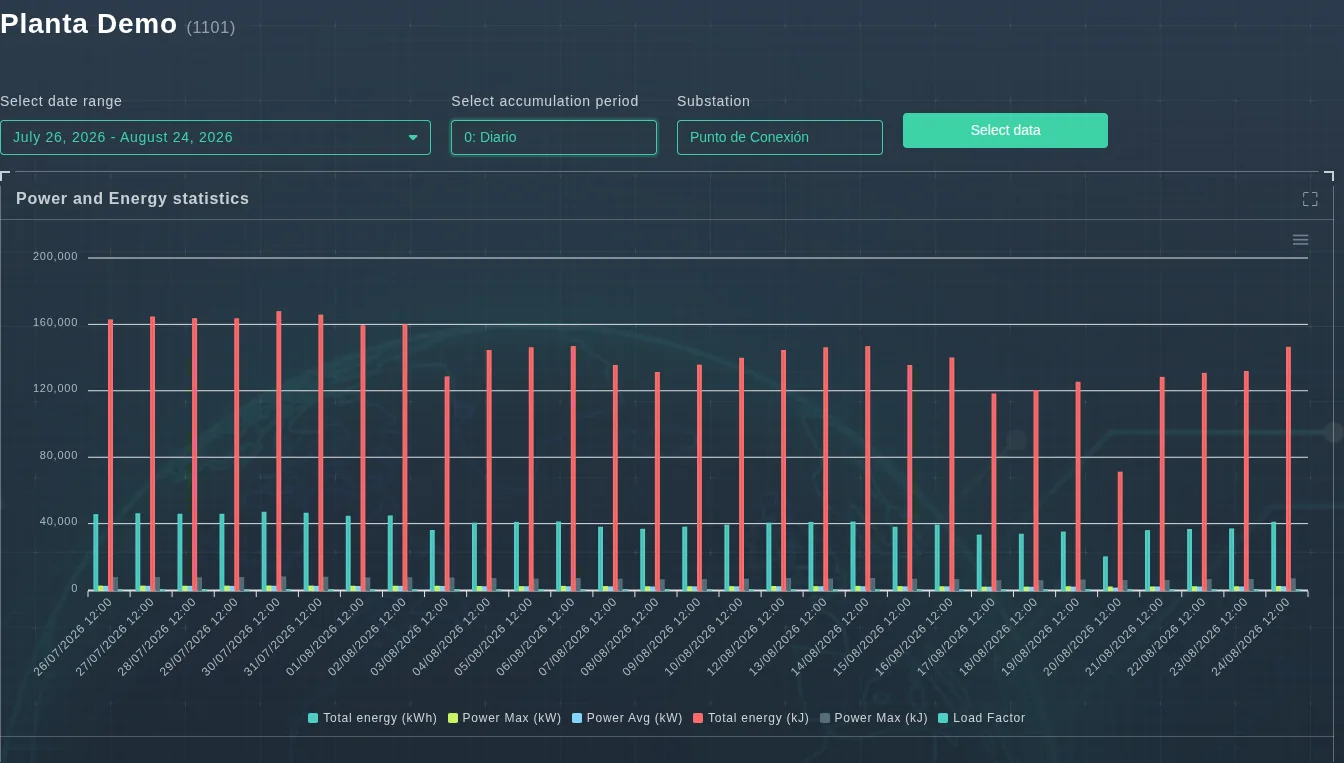
Power statistics with daily accumulation over the last 30 days
Daily accumulation over the last 30 days: each bar is a day, and the step in early August separates two operating regimes.
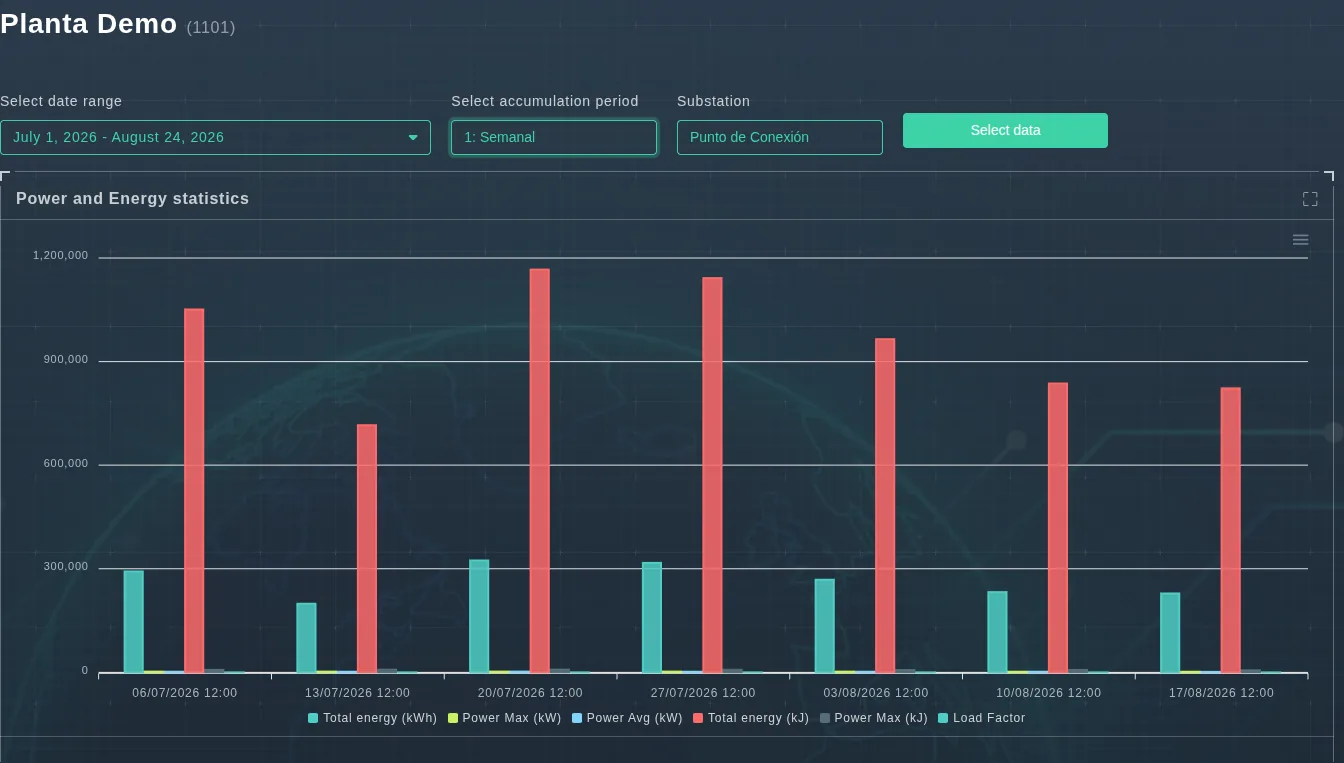
Power statistics with weekly accumulation from July to August
Weekly accumulation from 1 July to 24 August: daily noise disappears and the high and low weeks remain.
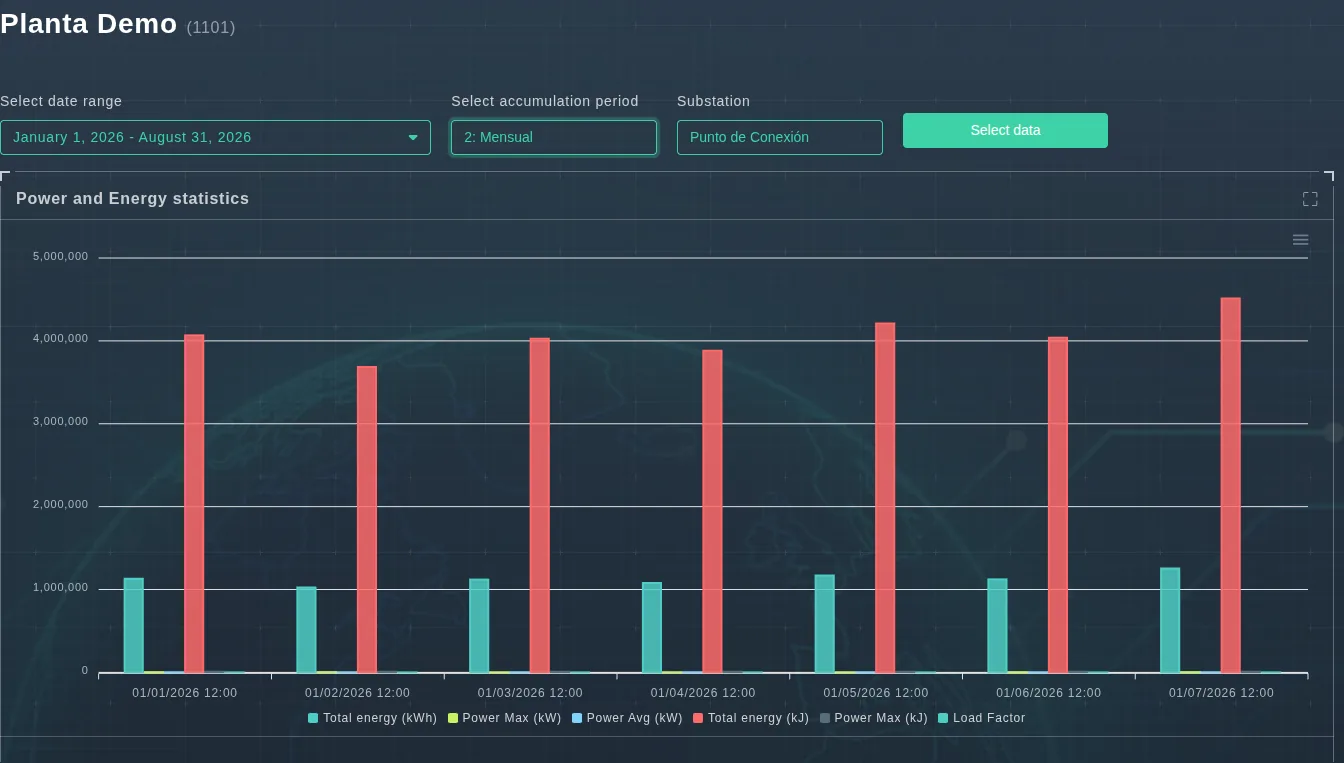
Power statistics with monthly accumulation for the year to date
Monthly accumulation from January to August: the view for comparing year on year and building the baseline.

Review your installation's statistics

Book an EVA-Smart AI demo and evaluate a real period from your plant.

Request a demo