How it is queried
Choose the period and the point, and the dashboard recalculates over that window: first the period indicators with twelve months of history, then the compliance table indicator by indicator.
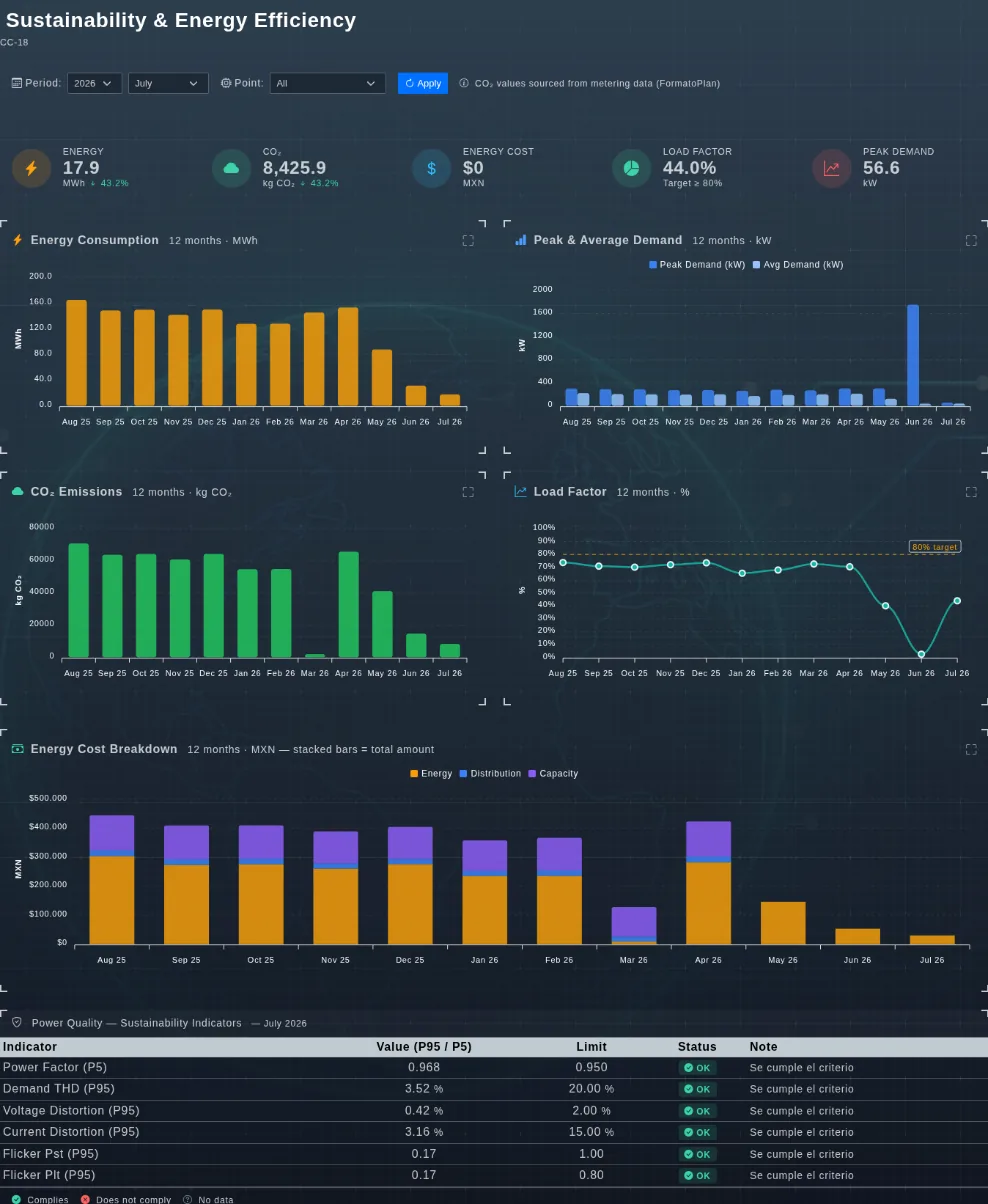
Controls
- Period: the window to evaluate.
- Point: the load center or measurement point.
- Apply: recalculates the whole dashboard.
What it is for
- Open a results meeting with one screen instead of six reports.
- Identify in seconds the indicator that will cost money or draw a finding.
- Track month to month an indicator that has already gone out of range.
- Record the reason for a deviation next to the data, not in a separate email.