Energy dashboard

The platform's main view: recent readings from every measurement point, with their trend over the last hours, their history, and alerts when a value moves out of range.

The screen you open first

The Energy Dashboard module brings together the installation's current electrical state — basic readings, power quality and consumption — on a single screen meant to stay open on a control-room monitor.

Every indicator comes in three layers: the current value, the trend across the selected hours, and the history for yesterday, the last 7 days and the last 30 days. That comparison is what turns an isolated reading into a useful signal.

Series carry an operating colour code — normal, degraded and critical — so a deviation is visible before you read the figure.

What it shows

  • Minimum and maximum voltage, with a trend per line (L1-L2, L2-L3, L3-L1) and a ±5% band around nominal
  • Average and maximum current, with a trend per phase
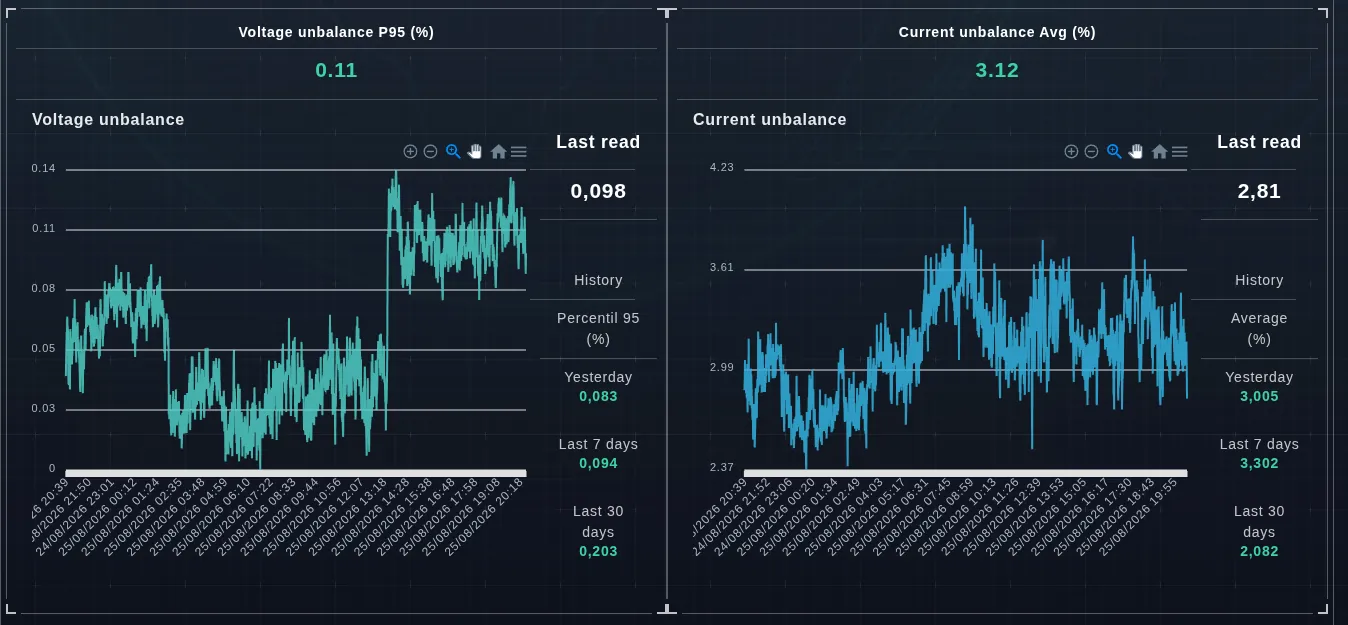
  • Voltage unbalance at the 95th percentile and average current unbalance
  • Latest readings per phase and their history for yesterday, 7 and 30 days
  • Even and odd harmonic components by order, with their 95th percentile
  • Energy consumed, maximum and average demand, and load factor
  • A timestamped incident log with criticality levels

How it looks in the platform

The dashboard is built by choosing load center, substation, granularity and analysis window, then switching data loading on.

How it is set up

  • Load center: the building or plant to query.
  • Substation or measurement point: narrows the analysis to one asset.
  • Granularity: from 1 to 60 minutes per plotted point.
  • Hours to analyse: sets the width of the trend window.
  • CSV export: the whole dashboard, and the notification list too.

What it is for day to day

  • Confirm the installation started the shift within range.
  • Catch a gradual degradation before it trips a protection.
  • Find which measurement point an event reported by operations came from.
  • Take the period's evidence into an external analysis without rekeying data.

What the dashboard shows, section by section

One screen, six blocks, updated continuously — the whole electrical state of a measurement point at a glance.
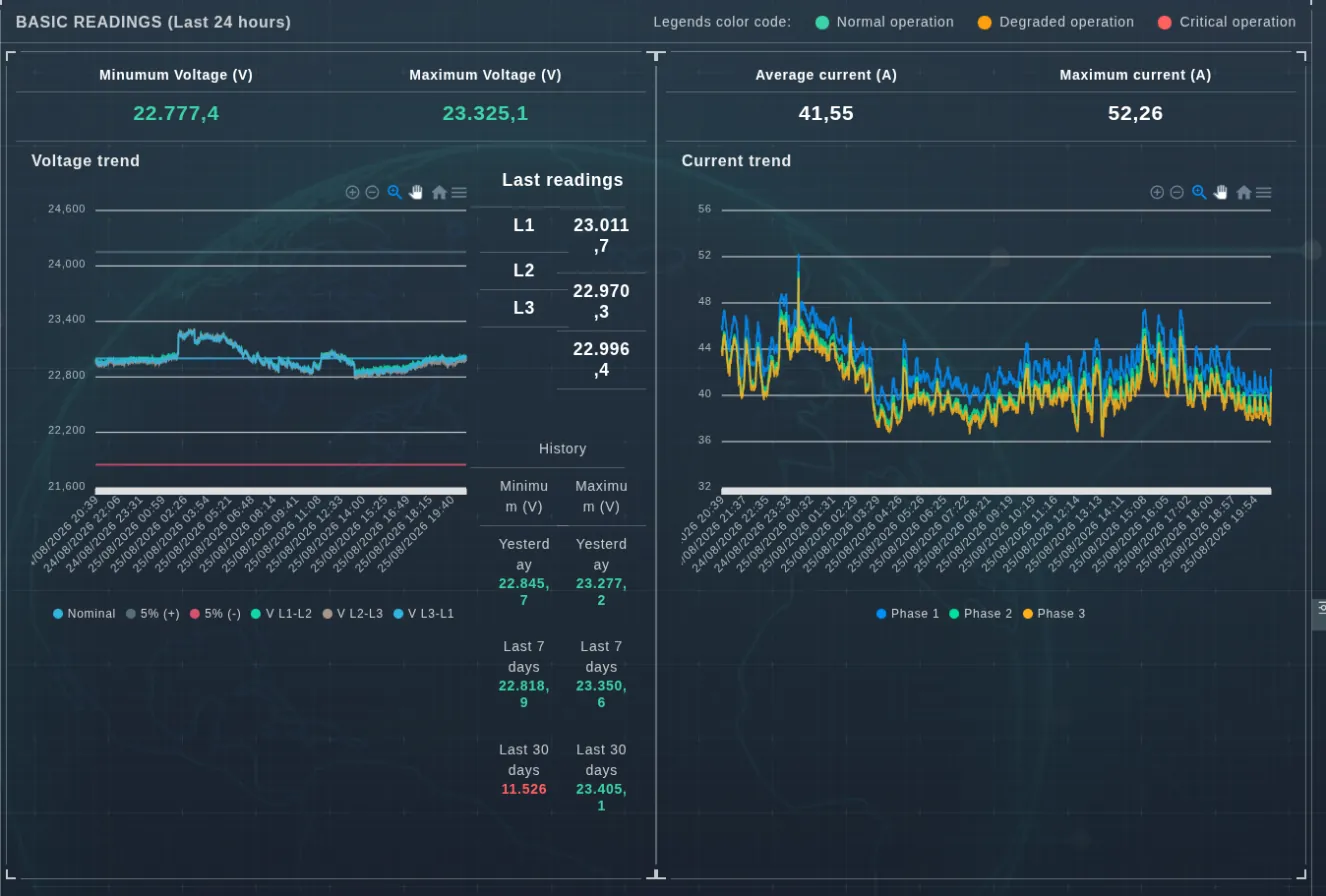
Basic readings: voltage and current trend per phase with their history
Basic readings. Voltage and current over the last 24 hours at one-minute resolution, with the ±5% band around nominal, the latest readings per phase, and history for yesterday, 7 and 30 days.
Voltage unbalance at the 95th percentile and average current unbalance
Unbalance. Voltage at the 95th percentile and current on average, each with its latest reading and history. The 14:00 jump in the voltage series gives away a load that came on unbalanced.
Quality readings: power factor and total harmonic distortion
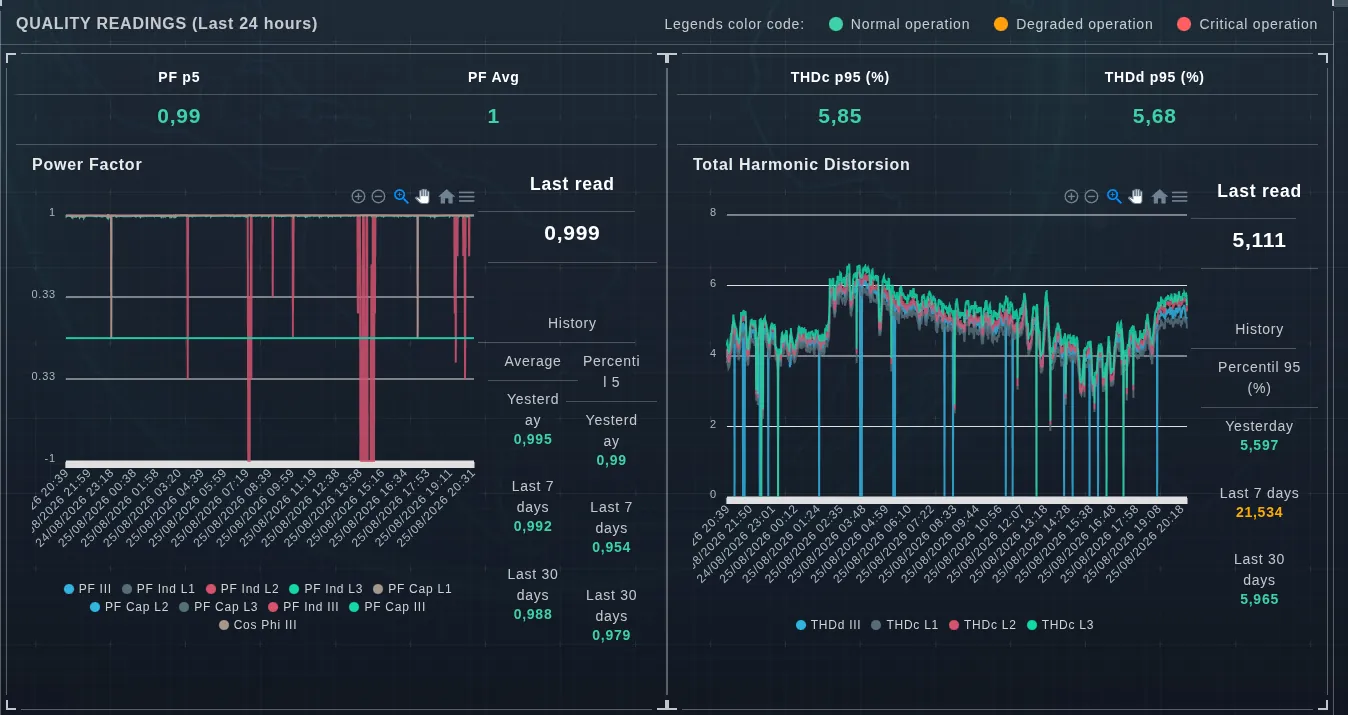
Quality readings. Power factor per phase and three-phase, and total harmonic distortion of current and demand, with the period's 95th percentile — the statistic compliance is judged on.
Even and odd harmonic components with their 95th percentile
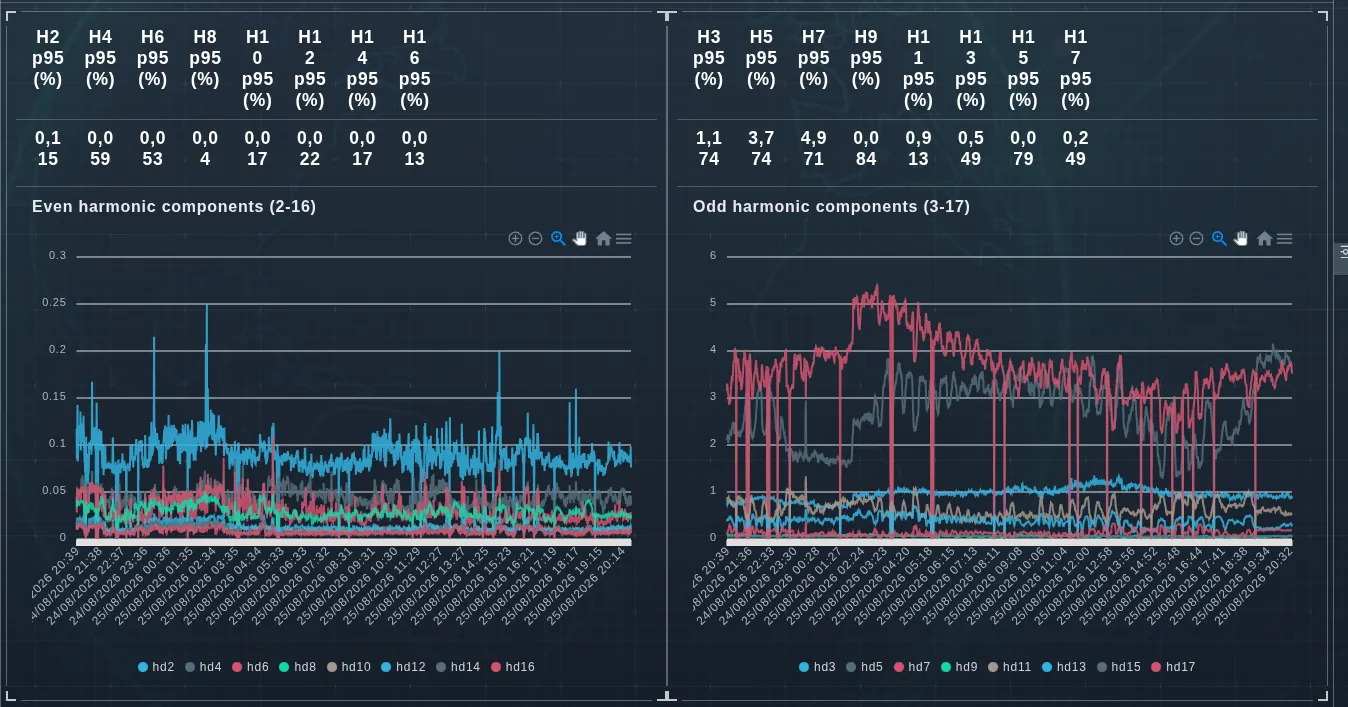
Harmonic components. Even orders 2 to 16 and odd orders 3 to 17, each with its 95th percentile. Here h5 and h7 dominate the rest: the signature of a six-pulse rectifier.
24-hour power and energy with load factor
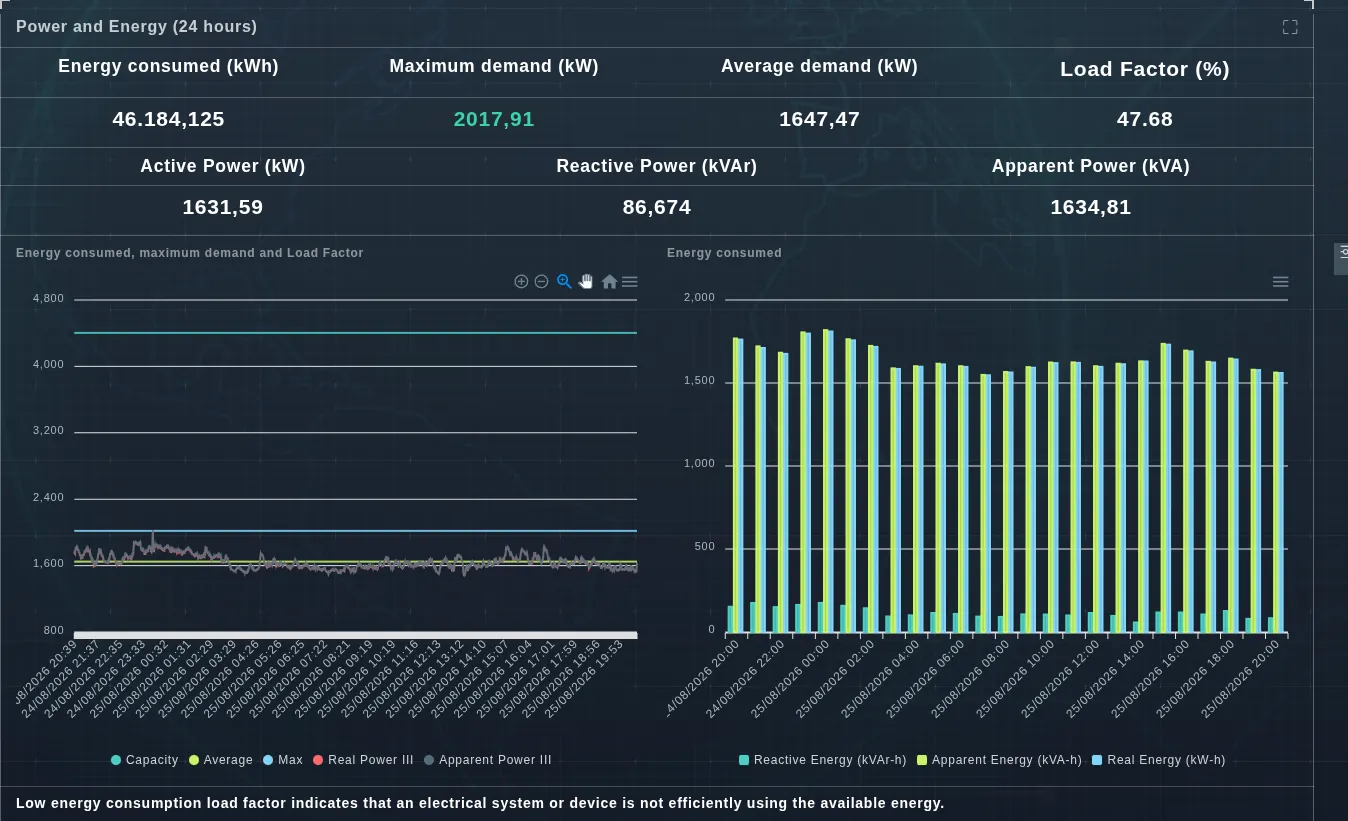
Power and energy. Energy consumed, maximum and average demand, load factor, and active, reactive and apparent power. A load factor of 47.68% points to contracted capacity that is not being used.
Power quality incident log with criticality level
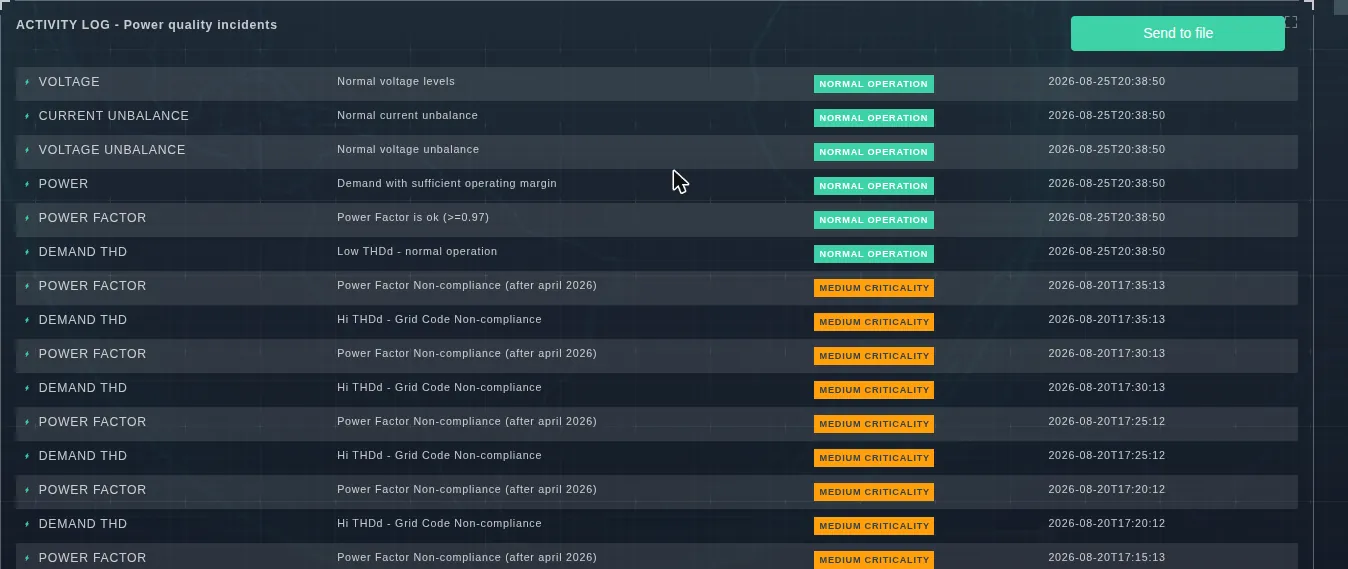
Incident log. Every evaluation is timestamped with its level: normal operation in green, medium criticality in amber. Here power factor and demand THD non-compliances against the Grid Code appear, with exact times, exportable to file.

See the dashboard on your own installation

Book an EVA-Smart AI demo and review your measurement points during the session.

Request a demo