From electrical variables to actionable indicators
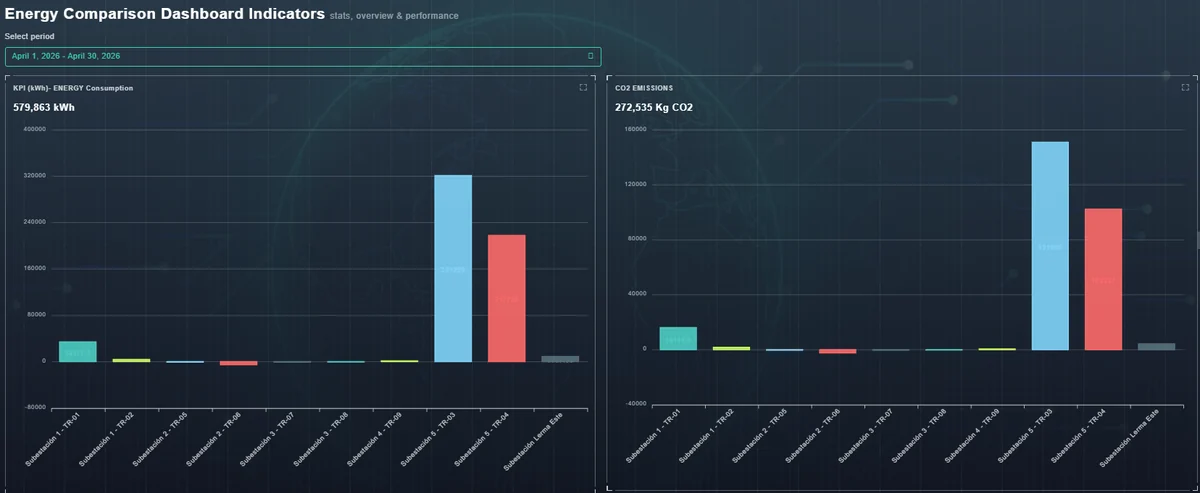
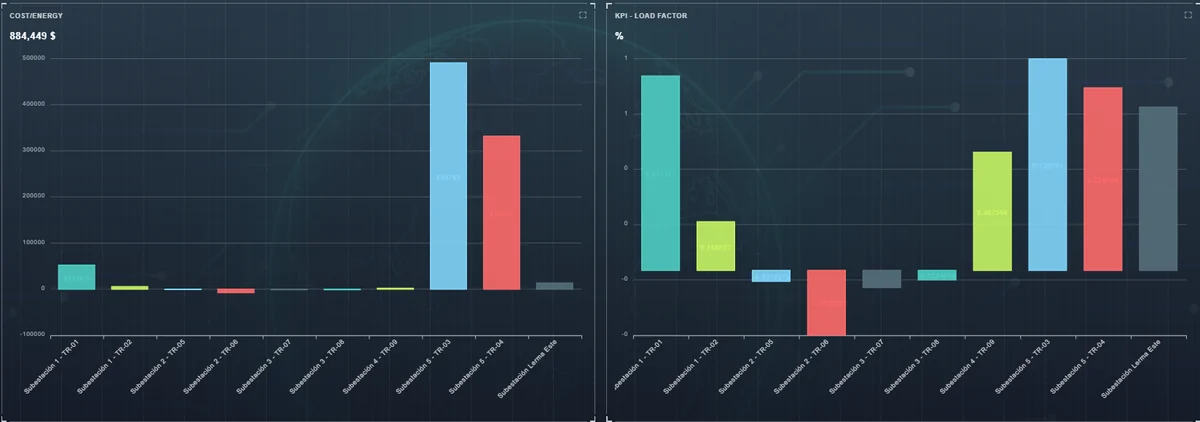
The Electrical Energy Efficiency module brings together consumption, cost, demand and operating metrics with one aim: turning electrical variables into indicators that cut cost, improve use of installed capacity and sustain an efficiency strategy.
Consumption and cost by tariff period
The dashboard summarises the period across Base, Intermediate and Peak windows plus the total, showing energy consumed (kWh) and associated cost for each. That breakdown shows where spend concentrates and is the starting point for shifting load.
Performance metrics
- Load factor: peak demand against average demand. A low factor means high peaks with poor average utilisation — and therefore room to cut maximum demand and capacity charges.
- Energy intensity: kWh per unit produced, energy cost per unit and tCO₂ per unit, where the site supplies production data.
- EnPIs: tracking energy performance indicators with a productivity lens.