The six criteria evaluated
Every criterion is computed from real measurement at the connection point and compared against its regulatory threshold, with a compliance traffic light.
Staying connected through voltage variations
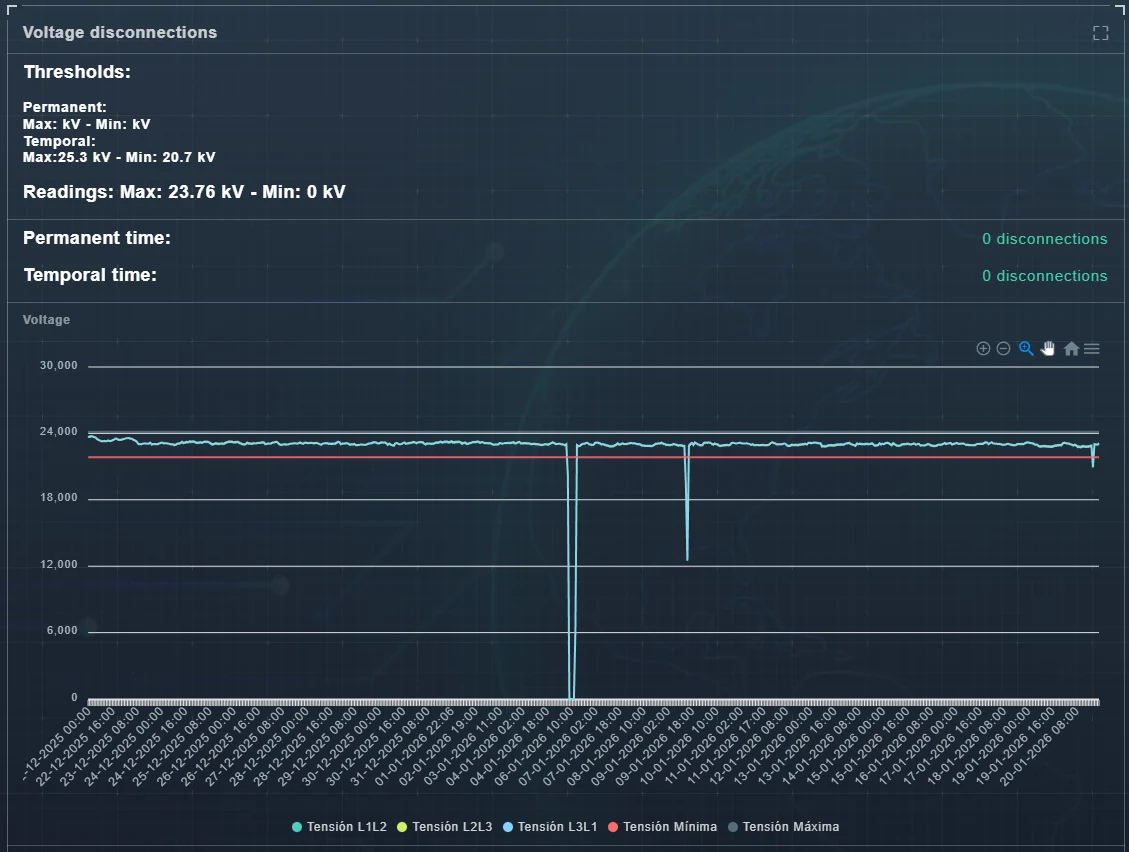
Assesses the Load Centre's ability to remain connected through line-to-line voltage variations, under two regulatory conditions.
- Normal Operating State: permanent connection while voltage stays between 95% and 105% of nominal. For 23.0 kV: 21.85 kV – 24.15 kV.
- Outside the Normal Operating State: temporary ride-through of up to 20 minutes within the widened thresholds.
The dashboard reports Permanent and Temporal thresholds, the disconnection count in each window, and the period's extreme voltage readings.
Staying connected through frequency variations
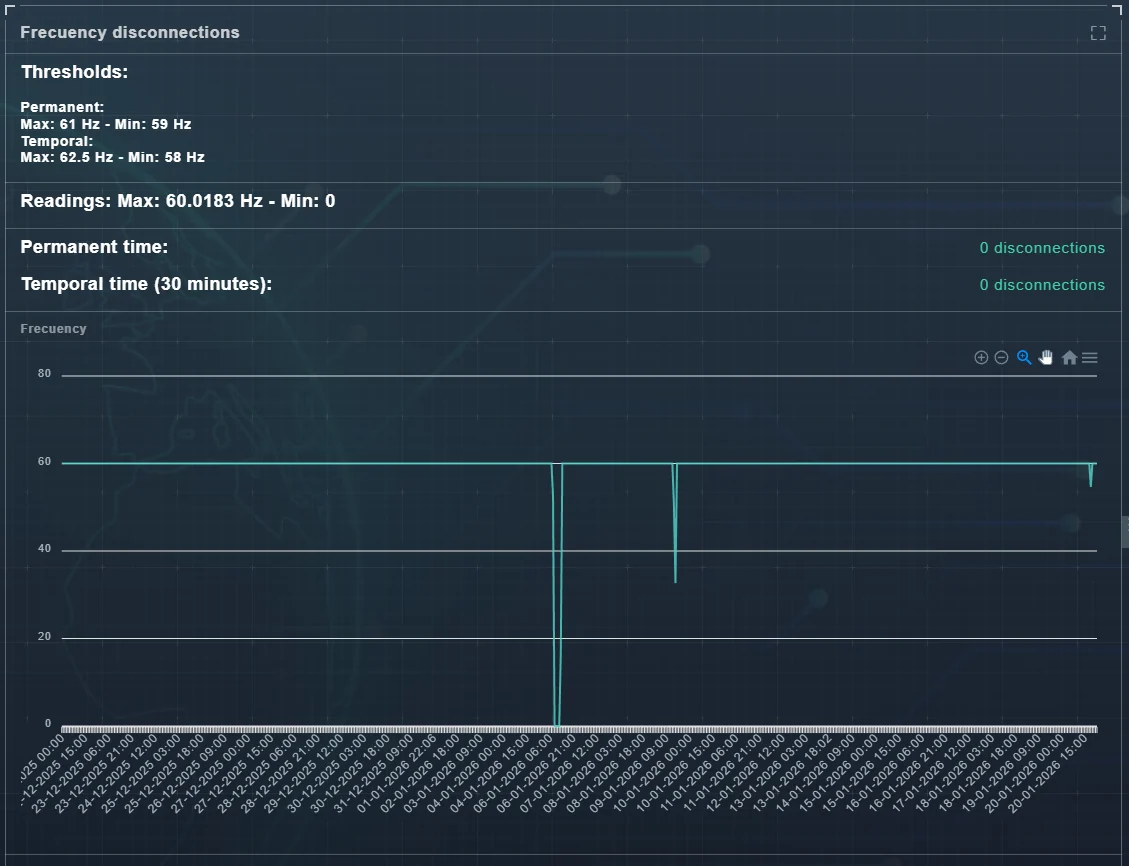
Assesses the Load Centre's ability to ride through frequency variations and stay connected within the ranges of Table 2.2.A.
- Permanent support: between 59.0 Hz and 61.0 Hz.
- Temporary support (up to 30 minutes): between 58.0 Hz and 62.5 Hz.
The trend chart helps identify and correlate events, but the regulatory outcome is set by the counts reported under Permanent time and Temporal time.
Power factor at the Connection Point
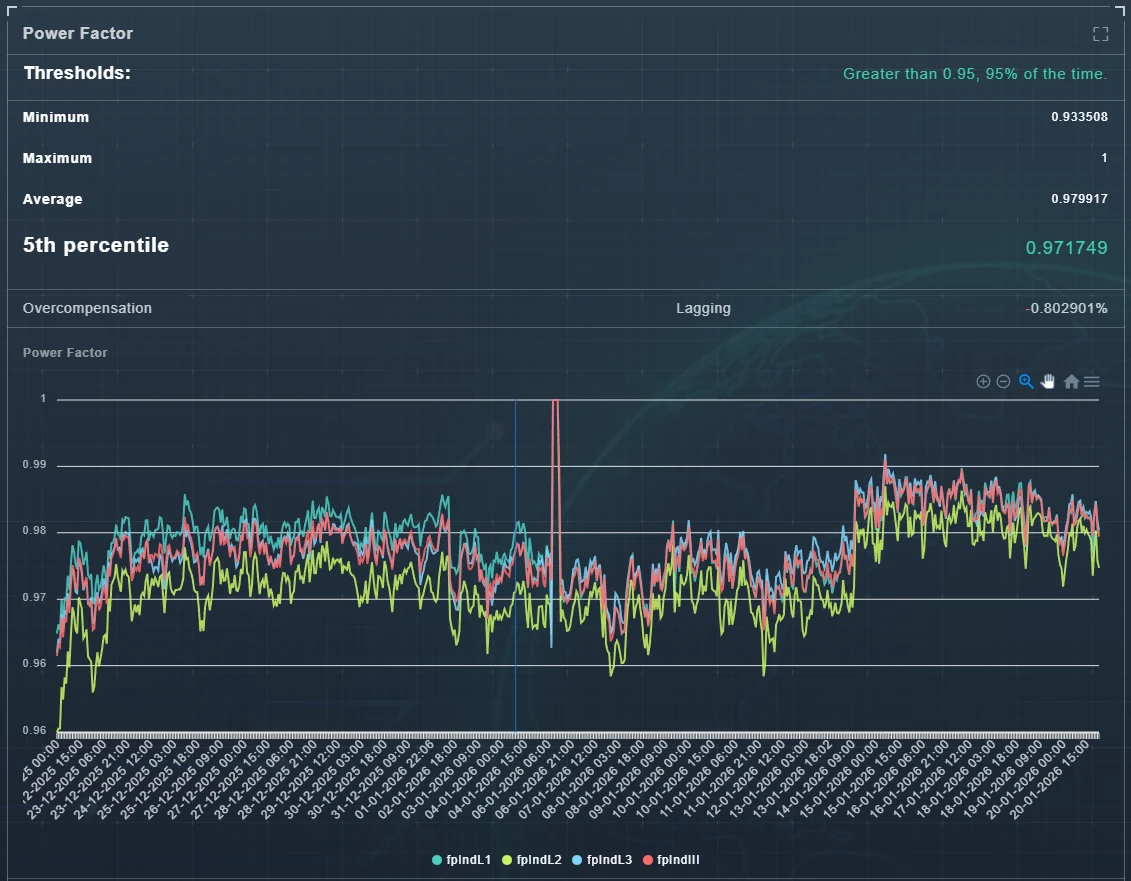
Applies to Medium Voltage Load Centres with contracted demand ≥ 1 MW and to all High Voltage ones. Power factor at the Connection Point, measured five-minutely, must hold at least 95% of the time across a monthly period.
- Until 8 April 2026: power factor between 0.95 lagging and 1.0.
- From 8 April 2026: power factor between 0.97 lagging and 1.0.
The dashboard reports minimum, maximum, average and the 5th percentile, alongside lagging and overcompensation conditions — which reveal whether an acceptable average is hiding capacitive periods or insufficient lag.
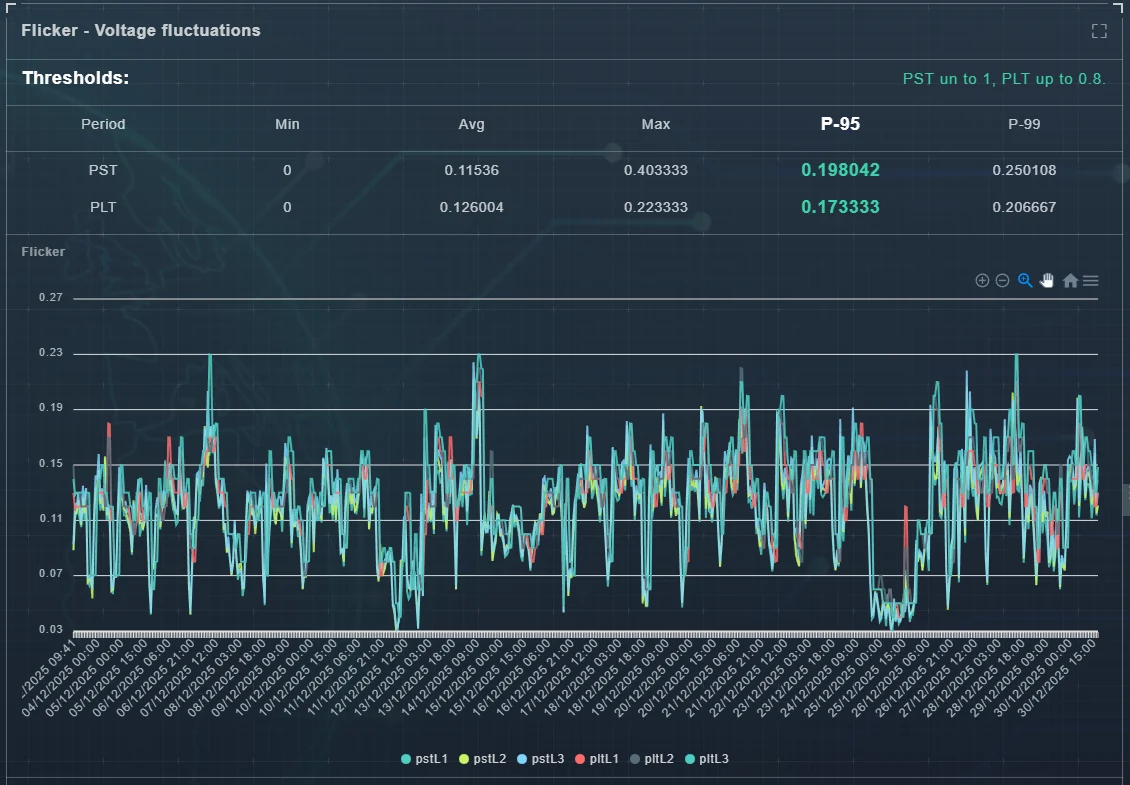
Voltage fluctuations
Limits voltage fluctuation at the Connection Point for Medium and High Voltage Load Centres, per the thresholds in Table 3.8.D.
- Pst < 1 — short-term severity over 10-minute windows; Pst = 1 is the irritability threshold.
- Plt < 0.8 — long-term severity over 2 hours, derived from successive Pst values.
These fluctuations typically originate in cyclic load operation and in interharmonic oscillations. The dashboard shows minimum, average, maximum and the P-95 and P-99 percentiles for each indicator.
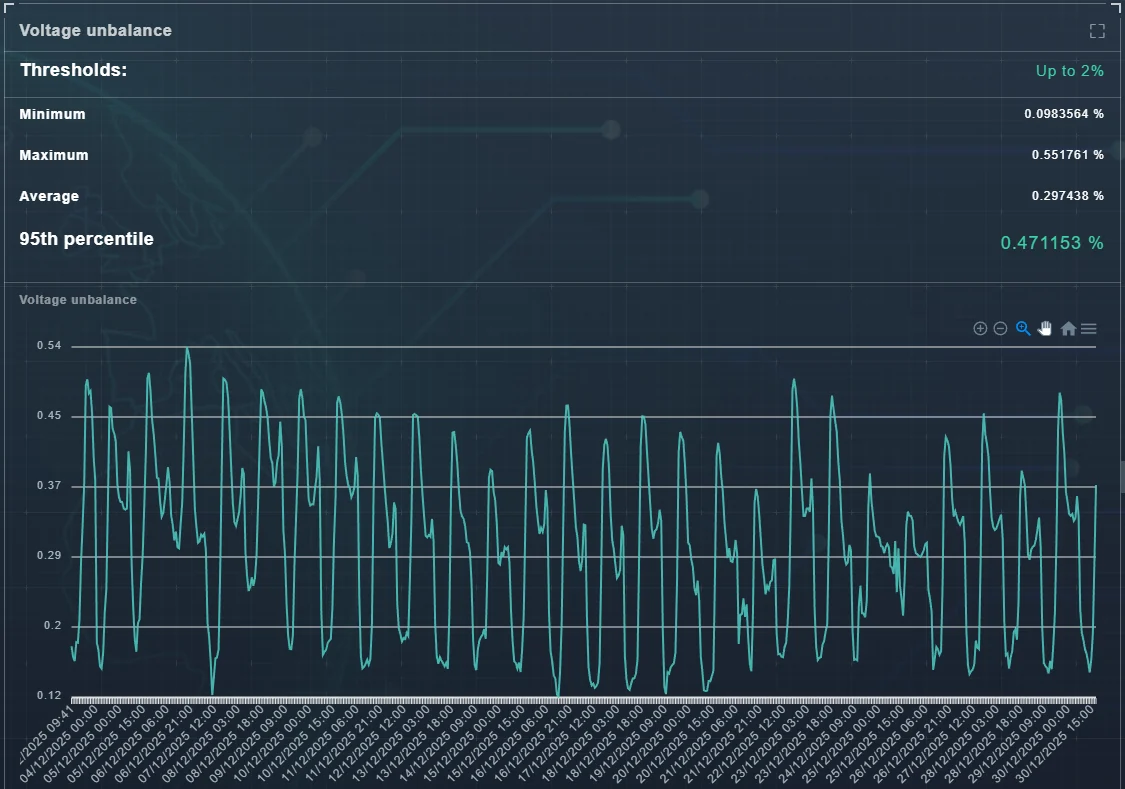
Voltage unbalance
Voltage unbalance arises from asymmetric load distribution across phases, single- or two-phase loads, protection and capacitor bank operation, and asymmetries in phase arrangement. It raises losses and can cause overheating and premature equipment failure.
- Limit: 2% at the Connection Point (Medium and High Voltage).
- Evaluated on 10-minute aggregation per NOM-001-CRE/SCFI-2019 and IEC 61000-4-30 Class A.
- The compliance value is the 95th percentile over a 7 calendar day week.
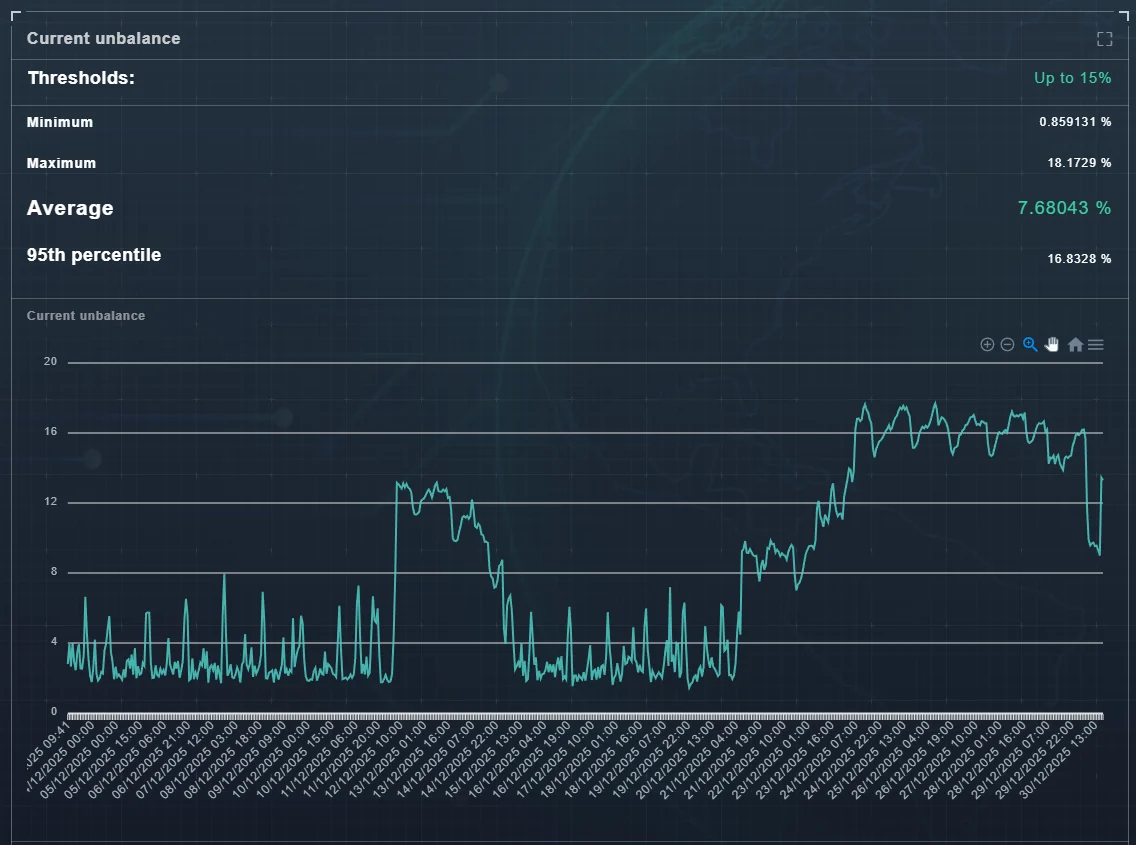
Current unbalance
Tied to uneven load operation across phases. It can overheat conductors and transformers, cause vibration in rotating machinery, raise Joule losses and disturb protection systems.
- Limit: 15% at the Connection Point (Medium and High Voltage).
- 10-minute aggregation under the same regulatory reference.
- The compliance value is the average of records across a weekly period.