From measurement to corrective decision
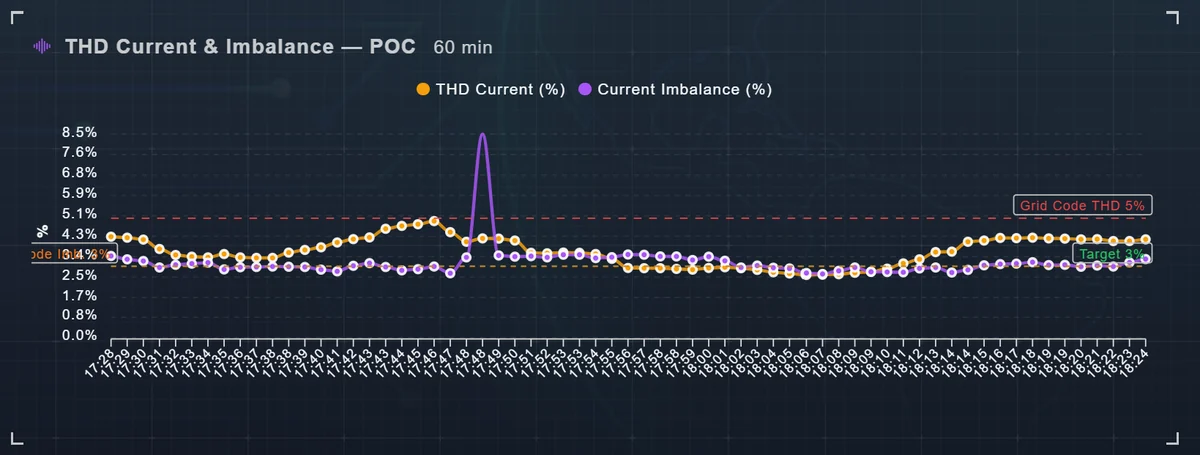
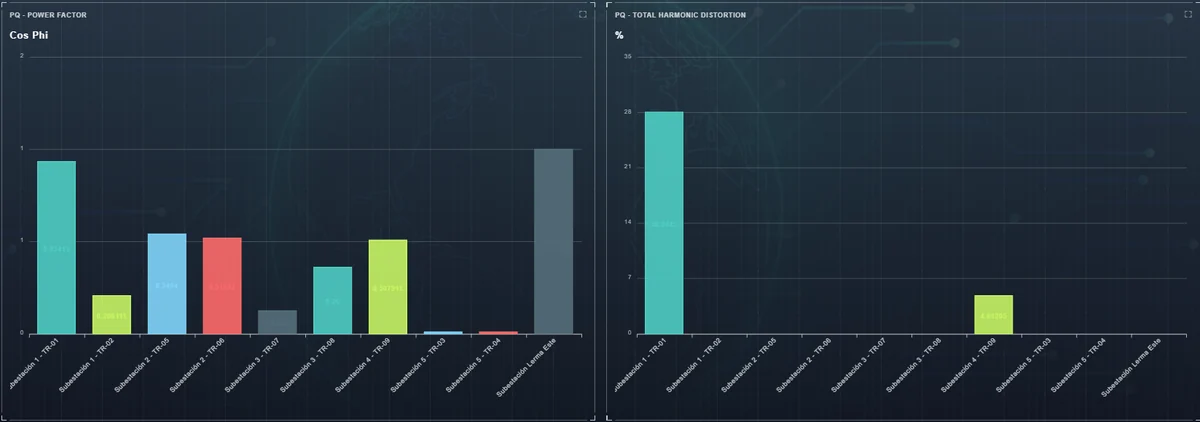
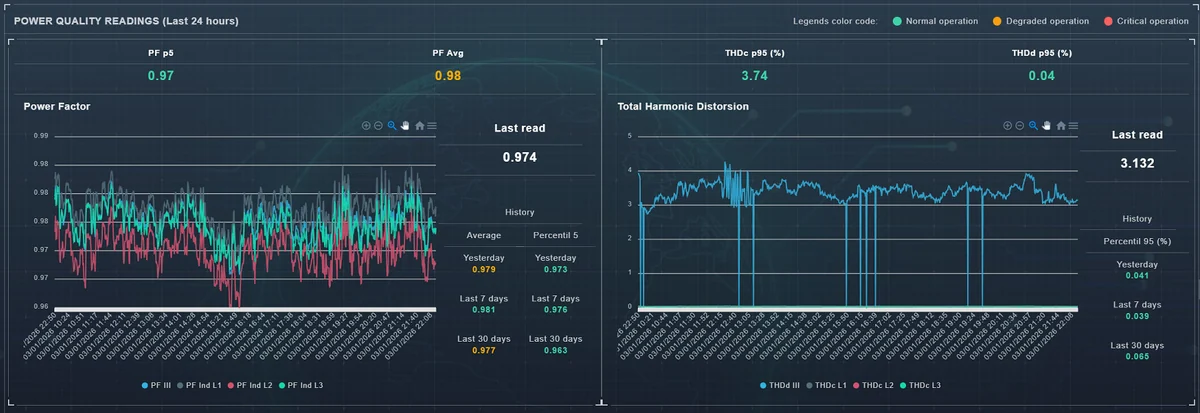
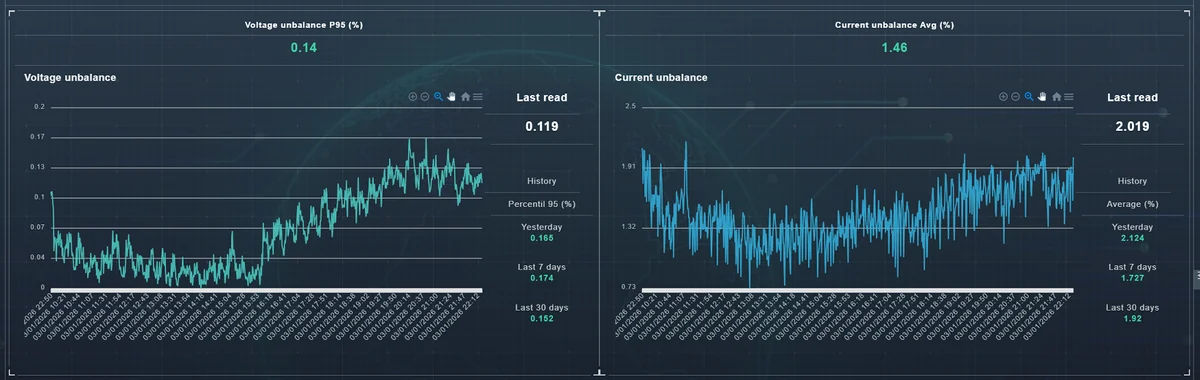
Each indicator comes with its headline statistic, its trend and a per-phase comparison — the key to knowing whether a problem is system-wide or localised.
What the analysis enables
- Trends: evolution, gradual degradation and recurring events.
- Patterns: by hour, day, week or operating cycle.
- Per-phase comparison: identifies asymmetry and locates the dominant phase.
Decisions it supports
- Power factor with a falling P5: sizing or adjusting capacitor banks.
- High or spiking THD: evaluating active or passive filters.
- Growing unbalance: load balancing, reviewing connections and protection.
- Repetitive flicker: correlation with cyclic loads and operational coordination.